API Security Audit
Introduction
Indusface WAS helps to test the APIs for identifying vulnerabilities. The scan process involves inspecting requests and identifying vulnerabilities and potential errors in the APIs. This helps API functionality and user experience. Also, customers can self-onboard the APIs and perform scans.
How to Register for API Scanning?
- Sign-up for Indusface WAS API Scanning.
- Select a plan that fulfills your requirements and click Proceed.
- Enter the URL in the respective field and click Proceed.
- Provide your valid email address in the respective field to send verification link. (or)
If email verification is not possible, click “Verify through other method”.
- Click on the Modify button to change the URL.
- Go to the provided email inbox to check the verification link. Click on the received link to verify.
- Once email verification is completed successfully, you’ll be redirected to a new page to perform API scanning.
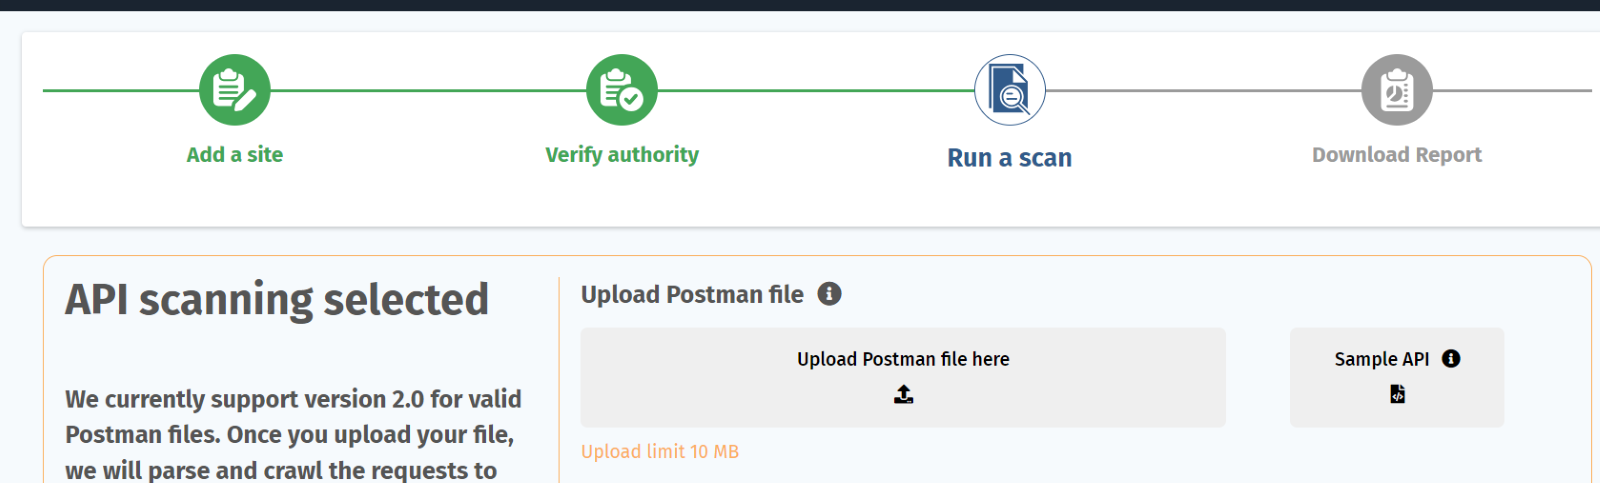
Run API Scan
- Upload the postman file.
- Click Test Now.
A sample API file is provided to understand the structure of JSON file.
The maximum postman file limit is 10MB.
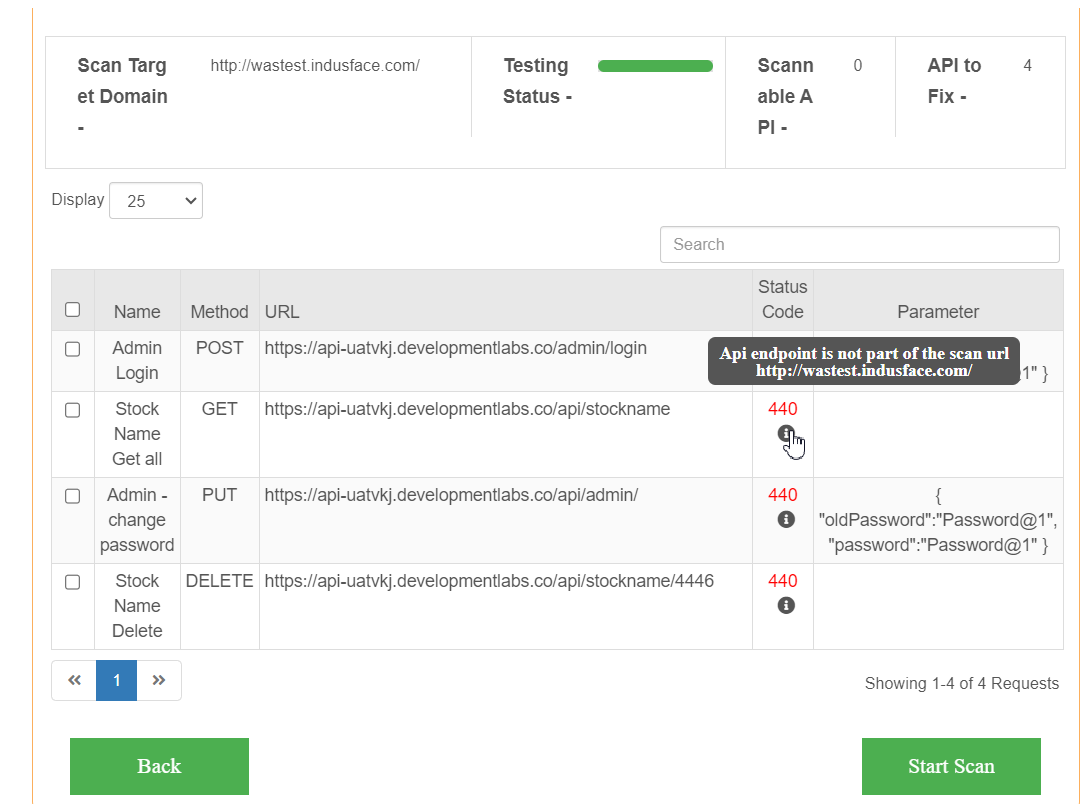
- Once the file is uploaded successfully, you’ll be redirected to a new page that contains the basic information of the postman file and required inputs to initiate the scan.
- For Trail plan users, only 5 APIs can be scannable.
- For Advance plan customers, either they can scan specific endpoints or all endpoints available in the postman file.
| Parameter | Description |
| Scan Target Domain | This field displays the onboarded domain name. |
| Testing Status | The green line indicates that |
| Scannable API | This field shows the number of APIs scannable from the uploaded postman file. |
| APIs to Fix | The number of APIs needs to be fixed, and customers resolve these APIs. |
| Display | Customer can show all the APIs from the postman file or select by first 10APIs or 25 APIs. |
| Name | API/ Endpoint name is displayed here. |
| Method | HTTP method used for CRUD actions. |
| URL | Endpoint or URL provides web address. |
| Status Code | Status codes are three-digit numbers that indicate the response of HTTP request. 2XX- Success Responses 3XX- Redirection Responses 4XX- Client Error Responses 5XX-Server Error Responses |
| Parameter | Parameters are added in HTTP request for customizing or modifying the request body. |
- Once the user clicks on the Start Scan, user’ll be navigated to API Security Dashboard.
API Security Dashboard
Web Applications:
Click on the drop-down menu to either select any one website or all sites.
API Security Dashboard contains scan details, host details, list of URLs, Top threats, and so on.
Scan Details
- Scan Completed – The total number of scans successfully completed.
- Scan Running – The total number of scans in progress.
- Total API Hosts onboarded- The total number of hosts/ domain URLs onboarded.
- Total vulnerabilities found- All the vulnerabilities found during the scans.
- Total endpoints scanned- All the endpoints scanned.
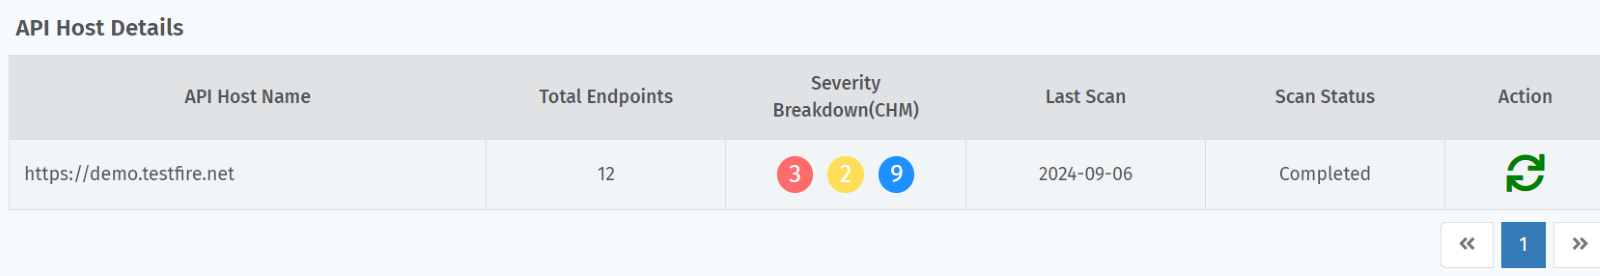
API Host Details
- API Host Name – Domain Name or Site Name is displayed.
- Total Endpoints- Count of Endpoints displayed.
- Severity- The total number of CHM (Critical, High, Medium) vulnerabilities found during the scan.
- Last Scan- Recent scan date.
- Scan Status- Scan status such as completed, or scan error is displayed after completion of scan.
- Action- Action field lets the customer to upload a different JSON / Postman file, select endpoints and initiate a new scan.
Add API Host
Click on the Add API Host button to onboard website for API Scan. Click here for the onboarding process.
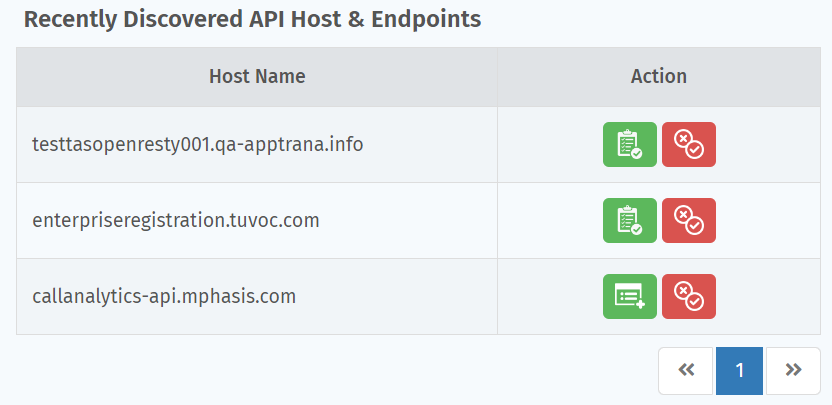
Discovered API Hosts
The list of API resources discovered is displayed in this table.
The action field in the table helps customers with email verification, onboard the discovered API host, or mark false positive.
- Onboard discovered API Host – Click Add Website to add API host and for the onboarding process click here.
- If any API Host is discovered incorrectly or identified as false positive, click false positive icon. After customer confirmation, API host is marked as False positive.
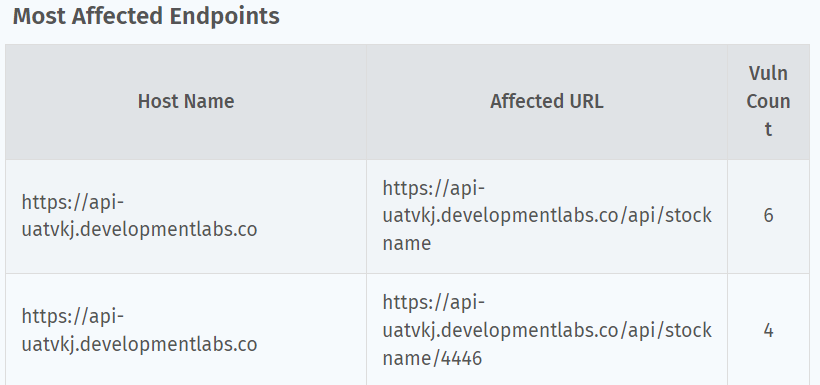
Most Affected Endpoints - This table displays the most affected endpoints with their host names and count of vulnerabilities.
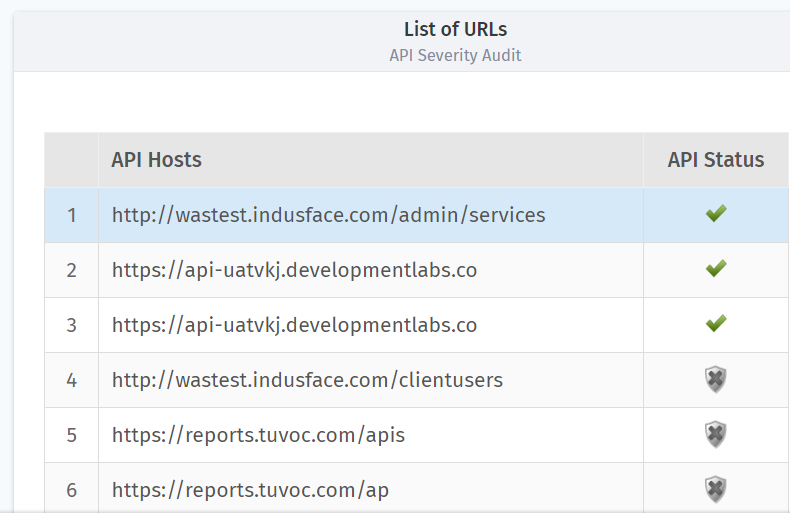
List of URLs- This table shows the total list of URLs along with their scan status.
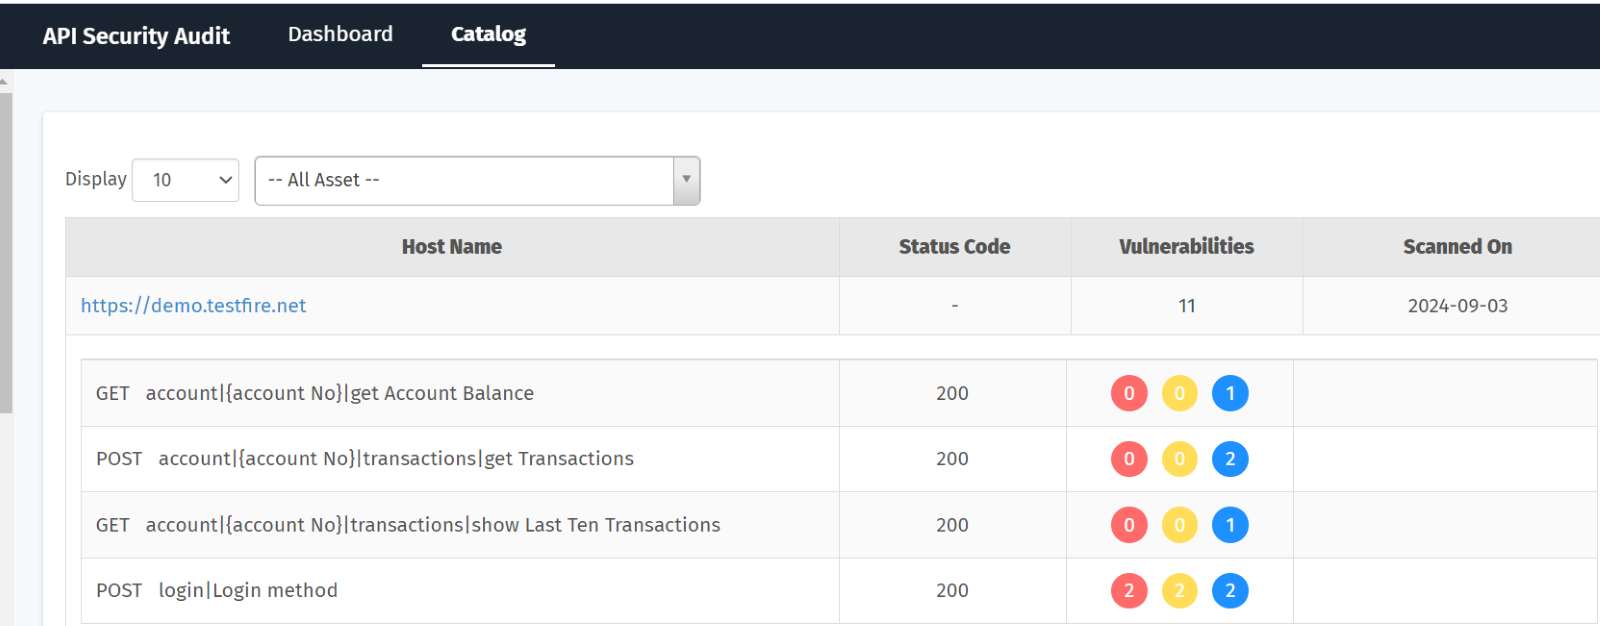
API Catalog
This section explains the details of onboarded API hosts and their details, also scanned APIs details.
| Parameter | Description |
| Host Name | The onboarded API Host name is displayed here. Also, each endpoint scanned, and the API request HTTP method also added. |
| Status Code | This field shows the HTTP response code. |
| Vulnerabilities | This field shows the total count of CHM vulnerabilities found during the scan. |
| Scanned On | API Scan date is displayed here. |
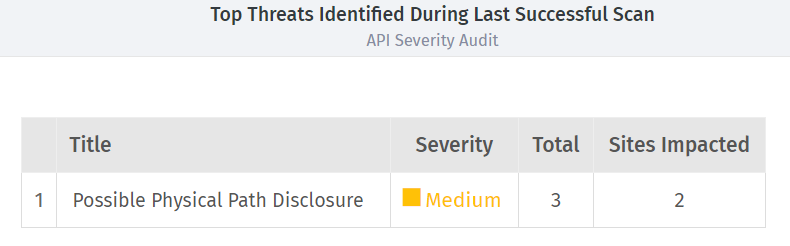
Top Threats Identified During the Last Scan- This table shows the list of vulnerabilities with details like vulnerability title, severity, count, and the count of impacted sites.
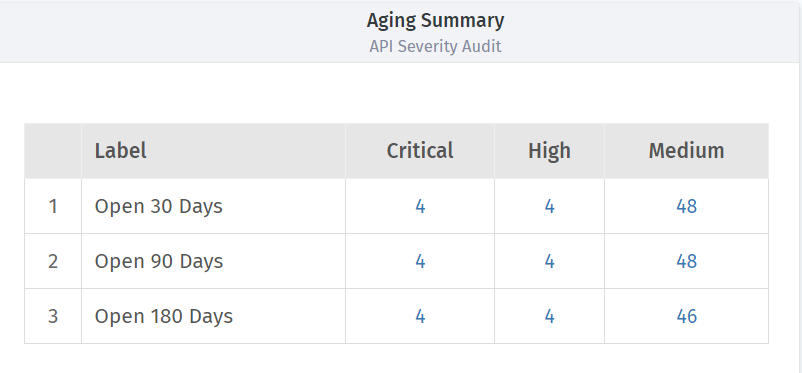
Aging Summary- This table shows the number of CHM (Critical, High, Medium) vulnerabilities identified during the last 30 days, last 90 days, and last 180 days.
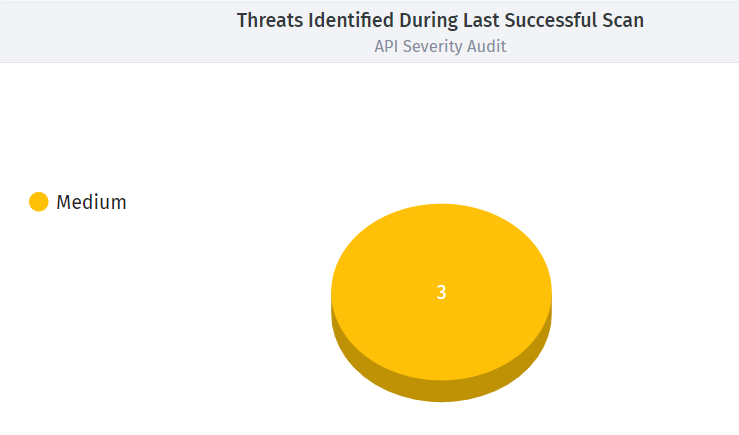
Threats Identified During Last Successful Scan- The pie chart displays the number of vulnerabilities identified in the last scan by severity.
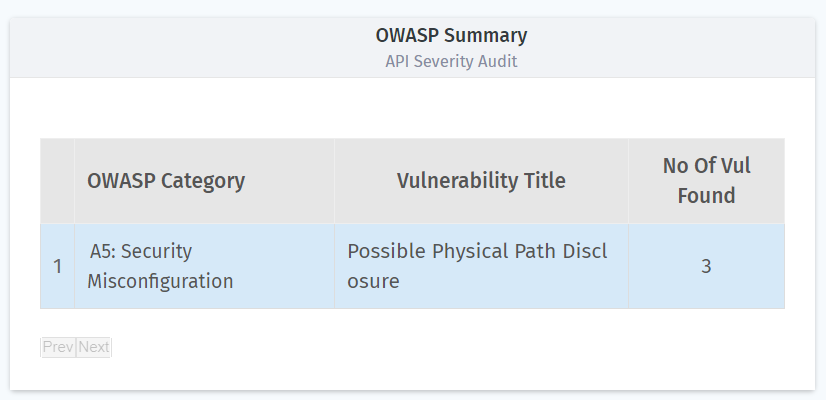
OWASP Summary- This plot shows the data of number of vulnerabilities found and their OWASP category details and vulnerability title.
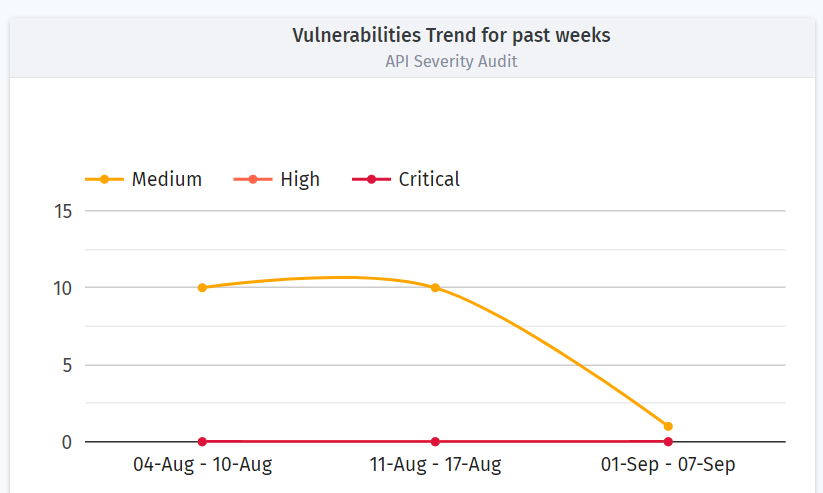
Vulnerability Trend for Past Weeks- This plot shows the data for vulnerabilities found in the three weeks based on their severity.