
Web App
Web App displays all vulnerabilities identified across scanned web applications, including vulnerabilities in forms, sessions, authentication flows, and application logic.
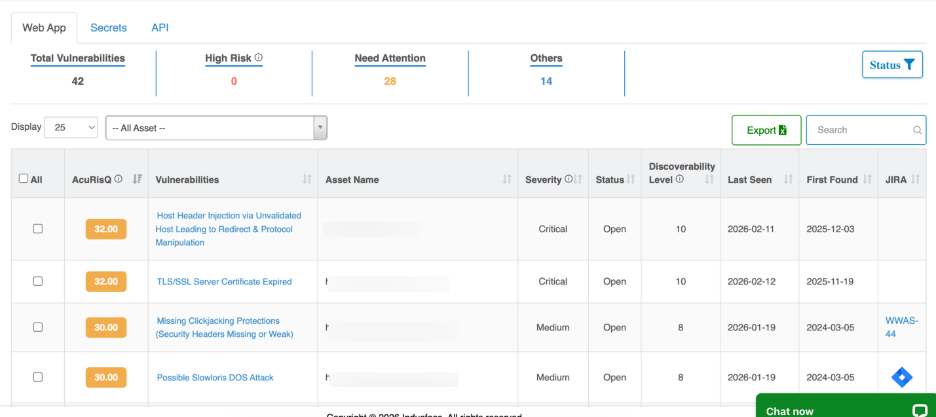
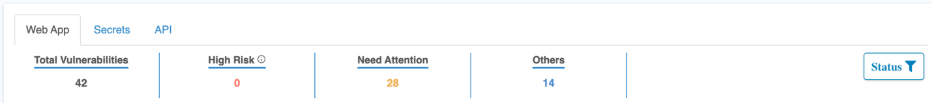
Vulnerability Summary Metrics
This section provides a real-time snapshot of the overall risk posture for the selected asset scope.
Metric | Description |
| Total Vulnerabilities | Total number of identified security vulnerabilities |
| High Risk | Vulnerabilities with high severity or elevated risk impact |
| Need Attention | Findings that are reopened, aging, or failed remediation |
| Others | Lower-priority and informational vulnerabilities |
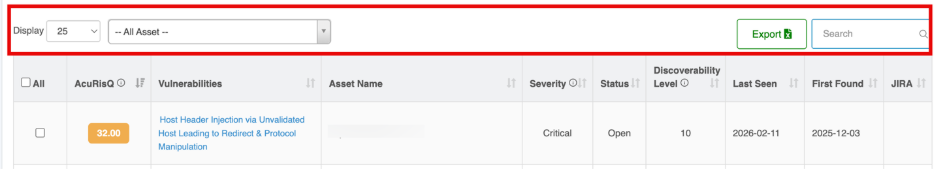
Vulnerability Filters and Actions
Control | Function |
| Asset Selector | Filters vulnerabilities by specific web application or endpoint |
| Results Display Count | Controls number of vulnerabilities shown per page |
| Status Filter | Filters by vulnerability lifecycle state (New, Re-open, Fixed, etc.) |
| Export | Downloads vulnerability data in report formats |
| Search | Keyword search across vulnerability name and assets |
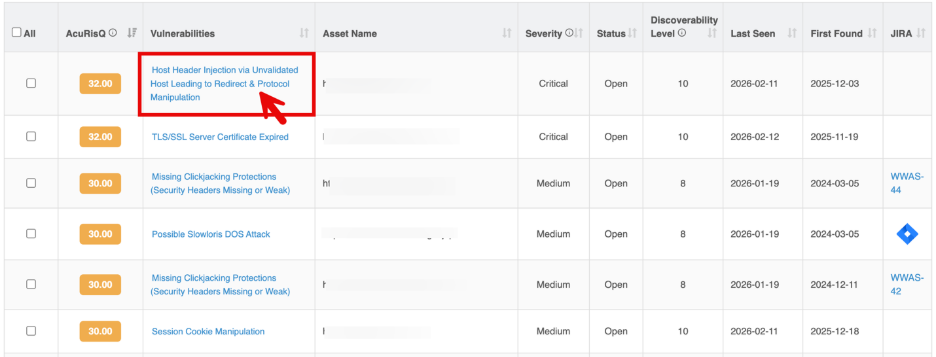
Vulnerability Listing Table
Each row represents a vulnerability detected by the WAS Scanner along with its risk context and remediation status.
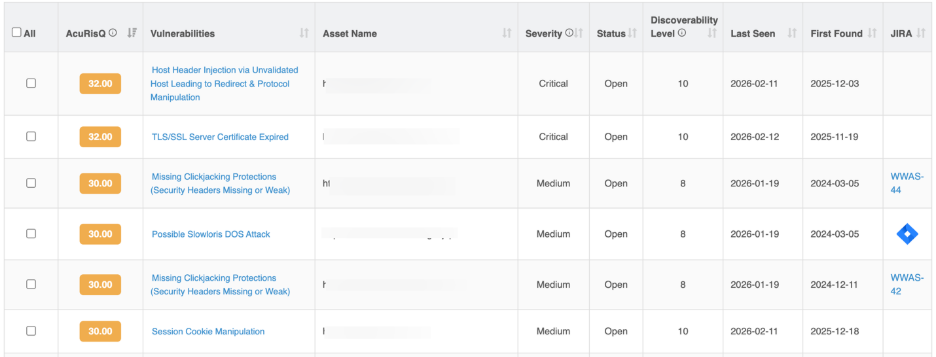
Column | Description |
| AcuRisQ Score | Contextual risk score based on severity, exploitability, exposure, and business impact |
| Vulnerability Name | The identified security vulnerabilities (e.g., Session Cookie Manipulation, Content Injection) |
| Asset Name | The affected application URL or API endpoint |
| Severity | Technical impact level (High, Medium, Low, Informational) |
| Status | Current remediation state (New, Re-open, Fixed, In Progress, Accepted Risk) |
| Discoverability Level | Indicates how easily the vulnerability was found during scanning |
| Last Seen | Most recent scan where the vulnerability was detected |
| First Found | Initial detection date |
Vulnerability Details
The Vulnerability Details page opens when you select an individual vulnerability from the vulnerabilities list, providing comprehensive technical evidence and risk context for that specific security vulnerbaility.
It enables security and development teams to validate findings, understand real-world impact, and apply precise remediation actions through exploit proof, confidence scoring, and expert verification.
This view combines automated detection with human validation to ensure high accuracy while minimizing false positives.
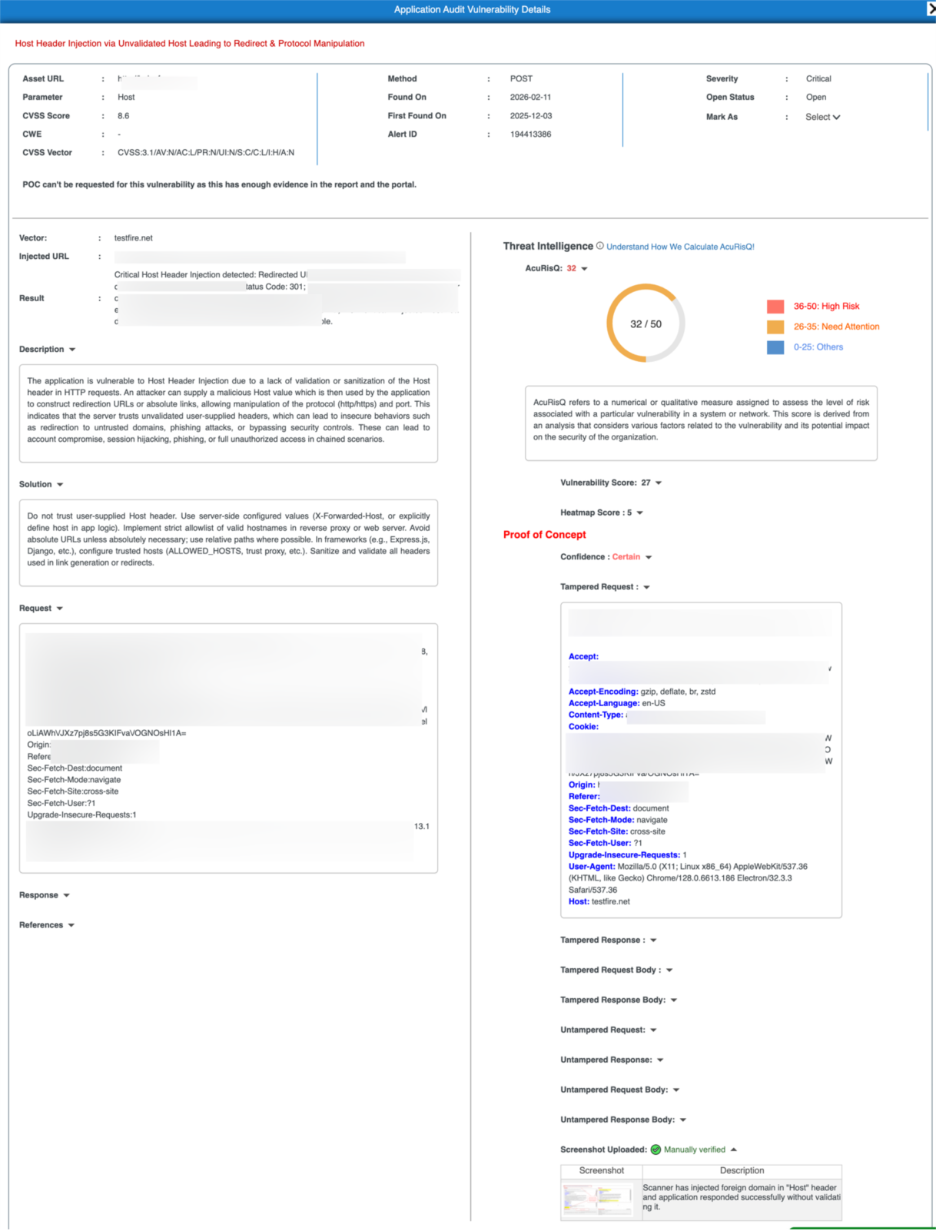
Vulnerability Summary
This section presents key attributes of the detected vulnerability.
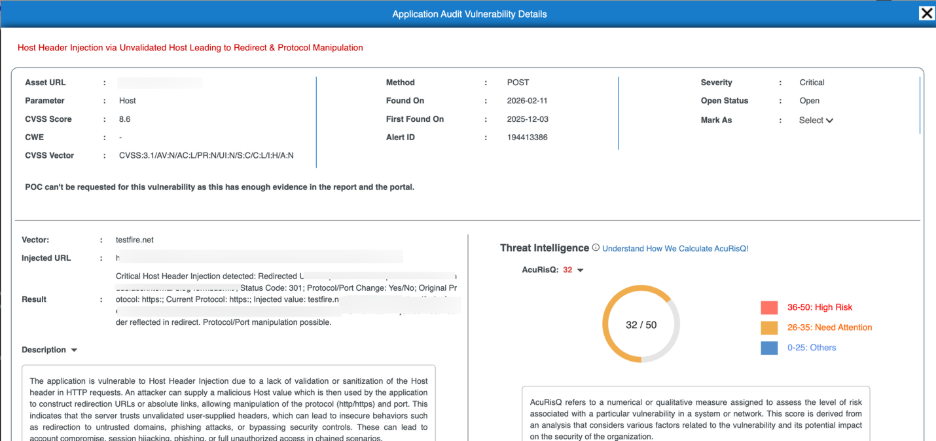
Field | Description |
| Asset URL | The affected application endpoint |
| Parameter | Input or header where the vulnerability was detected |
| HTTP Method | Request method used during detection |
| Severity | Technical impact level |
| CVSS Score & Vector | Standardized severity scoring |
| Found On | Latest detection date |
| First Found On | Initial discovery date |
| Alert ID | Unique vulnerability identifier |
| Status | Current remediation state |
Threat Intelligence – AcuRisQ Score
AcuRisQ provides contextual risk prioritization by analyzing:
- Vulnerability severity
- Exploitability
- Exposure level
- Business impact potential
- Attack feasibility
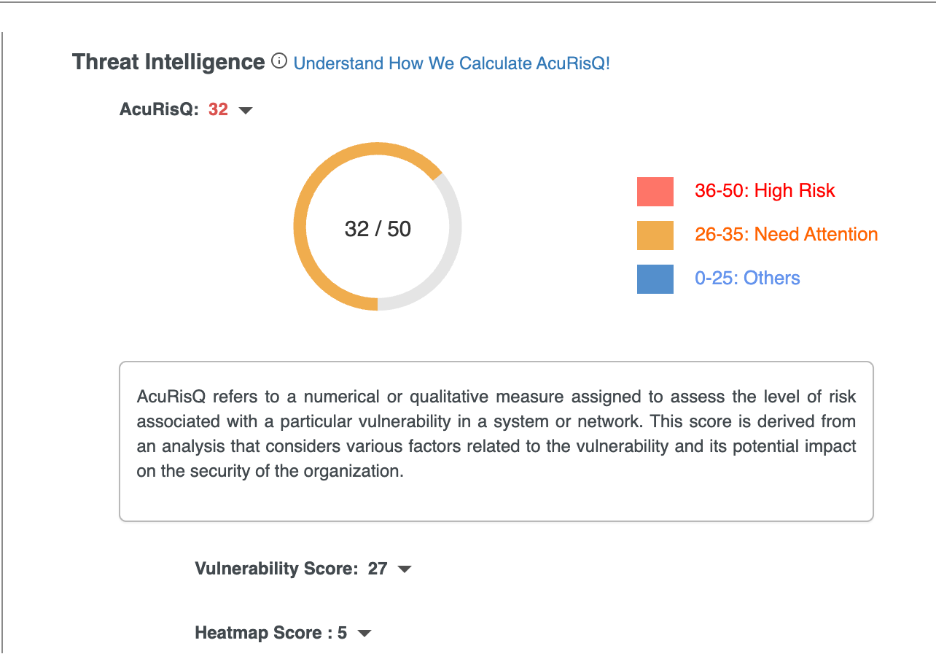
To learn more about AcuRisQ scoring logic and risk factors, click here.
Proof of Concept (PoC)
The Proof of Concept section transforms automated detection into verified security findings by combining manipulated traffic, response validation, confidence scoring, and human-confirmed evidence.
Every PoC is supported by behavioral evidence and manual validation where applicable. This ensures teams focus only on real, exploitable vulnerabilities.
PoC Components
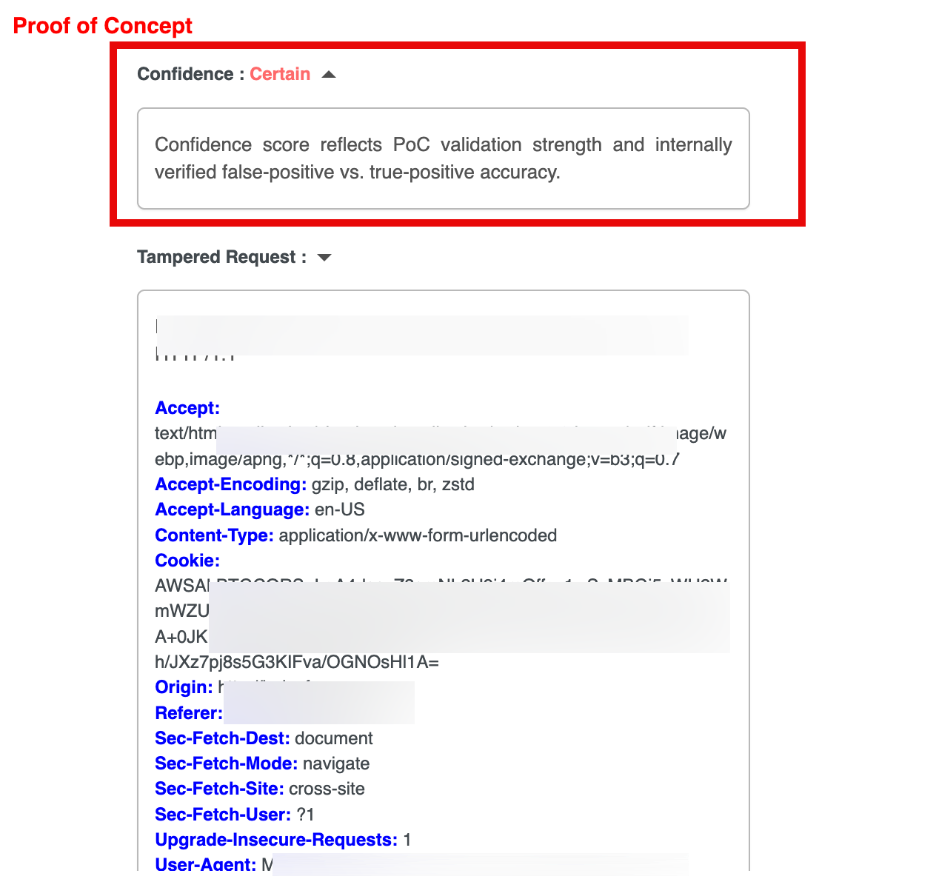
Confidence Score
The Confidence Score reflects the certainty level of the detected vulnerability based on behavioral validation and exploit consistency.
Confidence Levels
| Level | Meaning |
| Certain | Fully validated with confirmed exploit behavior and real attack evidence |
| Substantial | Strong, consistent indicators with high likelihood of validity |
| Maybe | Partial or inconclusive signals that require further verification |
Tampered Traffic (Attack Evidence)
These sections show how the vulnerability was exploited.
Component | Purpose |
| Tampered Request | The modified HTTP request used to trigger the vulnerability |
| Tampered Response | Server response after the attack attempt |
| Tampered Request Body | Modified payload data sent in the attack |
| Tampered Response Body | Application output after exploitation |
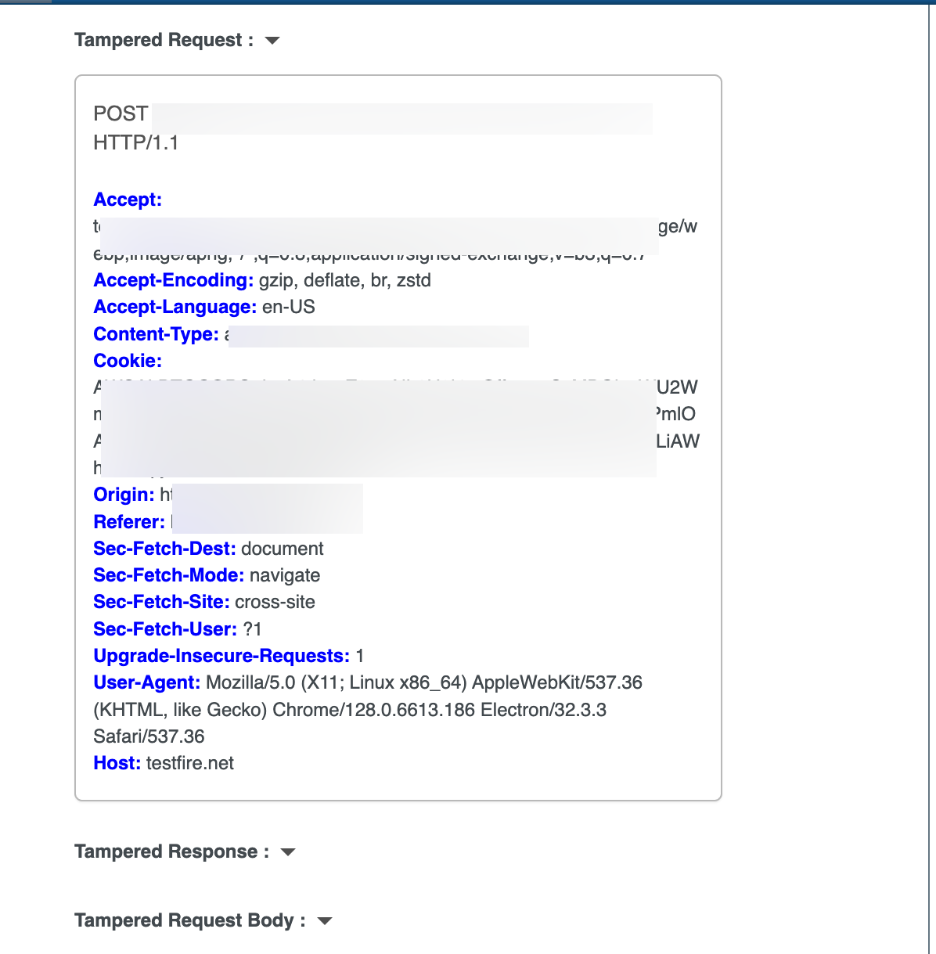
Note: Comparing tampered vs. untampered traffic confirms that the abnormal behavior is caused by the exploit .
Untampered Traffic (Control Evidence)
These sections display normal application behavior without malicious input.
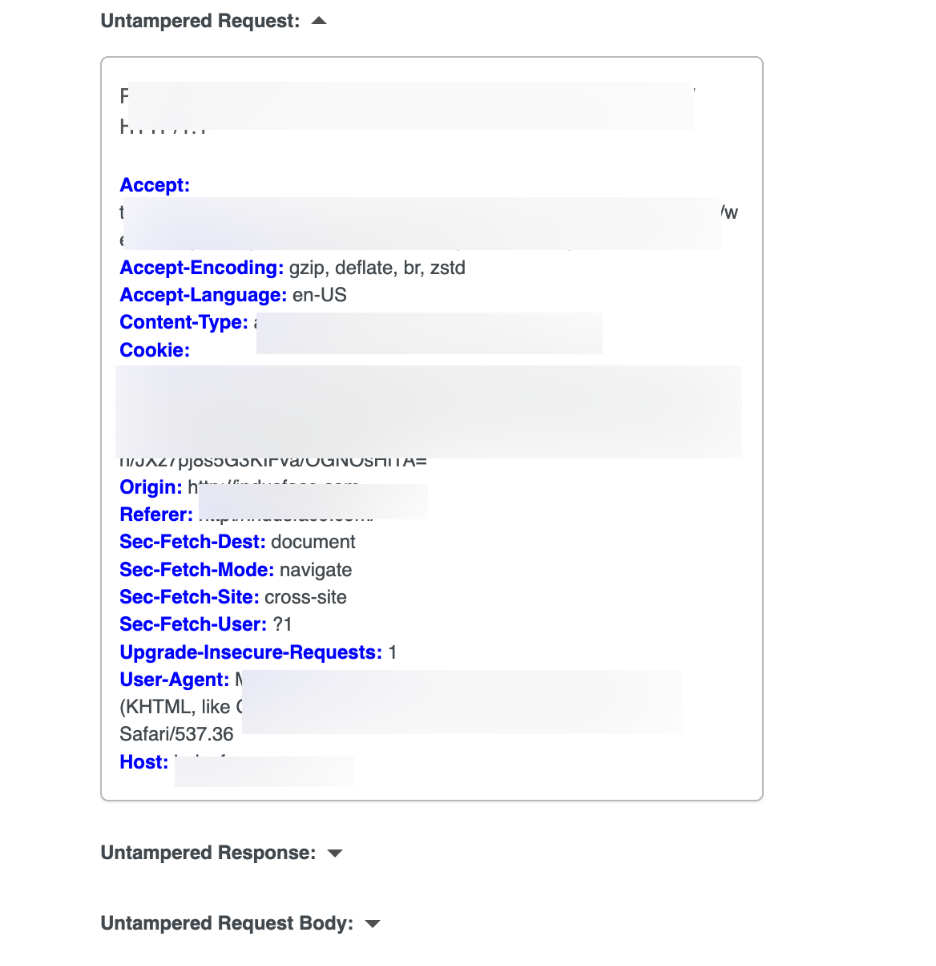
Component | Purpose |
| Untampered Request | Original request without injected payload |
| Untampered Response | Normal application response |
| Untampered Request Body | Legitimate payload data |
| Untampered Response Body | Expected server output |
Manual Verification Evidence
The Manual Verification Evidence section provides human-validated confirmation of detected vulnerabilities through supporting screenshots and expert observations.
This ensures that vulnerabilities marked as Manually verified are not solely automated findings but have been reviewed and confirmed by security specialists.
Evidence Table
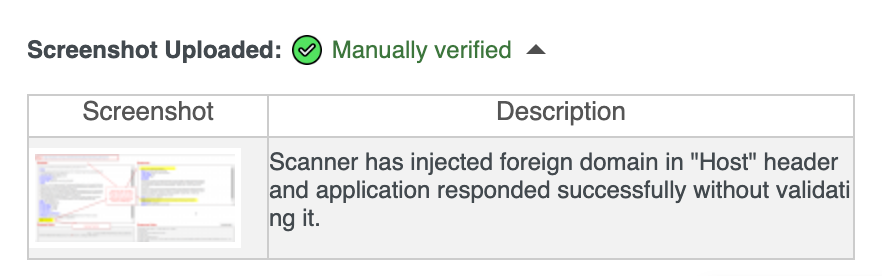
Each manually verified vulnerability includes visual proof and analyst context.
| Field | Description |
| Screenshot | Clickable visual capture that opens a detailed evidence view of successful exploitation or vulnerability impact |
| Description | Analyst explanation of what was tested and the observed behavior |