
Dashboard
The Dashboard gives MSSPs a consolidated, real-time view of customer application security posture across all managed sites.

Key highlights include:
- Threat Severity Overview: Findings are automatically classified as Critical, High, or Medium, with charts and widgets providing clear visual breakdowns.
- Interactive Widgets: Each widget focuses on a specific security dimension (e.g., vulnerabilities, trends, OWASP summary) and updates based on the chosen site or group.
- Customizable Layout: Easily arrange, add, or remove widgets to focus on what matters most to your role.
- Latest & Historical Data: View both the most recent scan results and historical vulnerability trends to track remediation progress.
- Always Up-to-Date: Information refreshes dynamically as scans run, giving you an accurate, current picture of security risks.
Widgets such as Threats Identified During Last Scan, Aging Summary, Application Audit, and Vulnerability Trends allow you to filter findings by All Scans, Manual PT or Automated Scans, giving MSSPs flexible visibility into security posture across different testing methods.
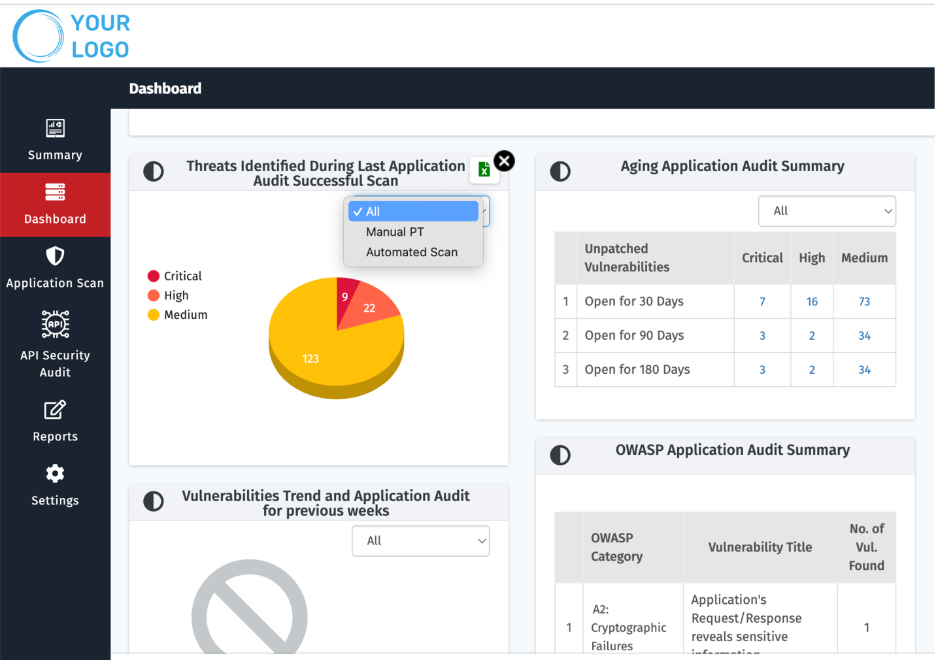
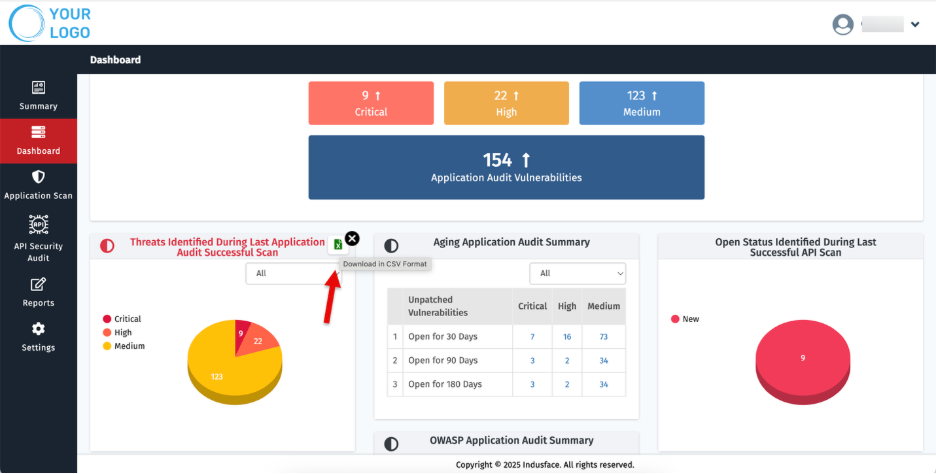
Use the CSV export to share findings with remediation owners.
Customizing the Dashboard
You can tailor the Dashboard for each client or group of sites to highlight the most relevant insights.
1. Reorder Widgets (Drag & Drop)
- Hover over a widget header.
- Drag the widget and drop it into the desired position to prioritize client-specific views (e.g., show Critical threats at the top).
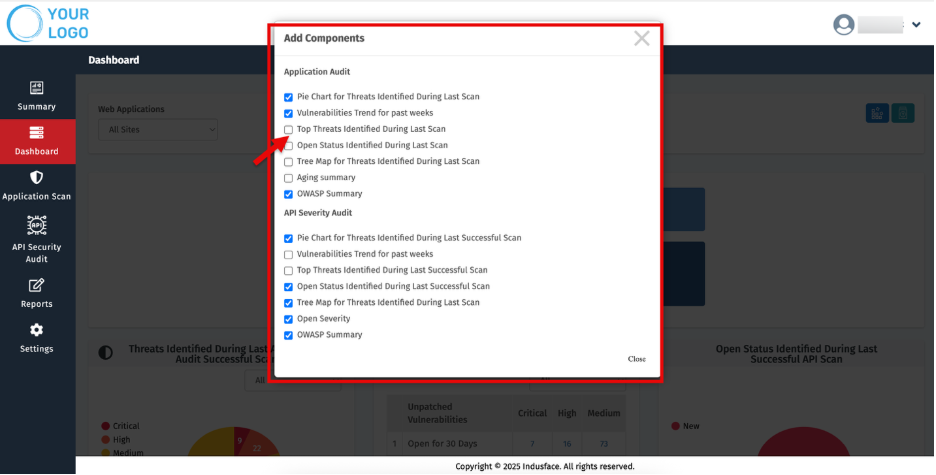
2. Add Components
- Click Add Component.
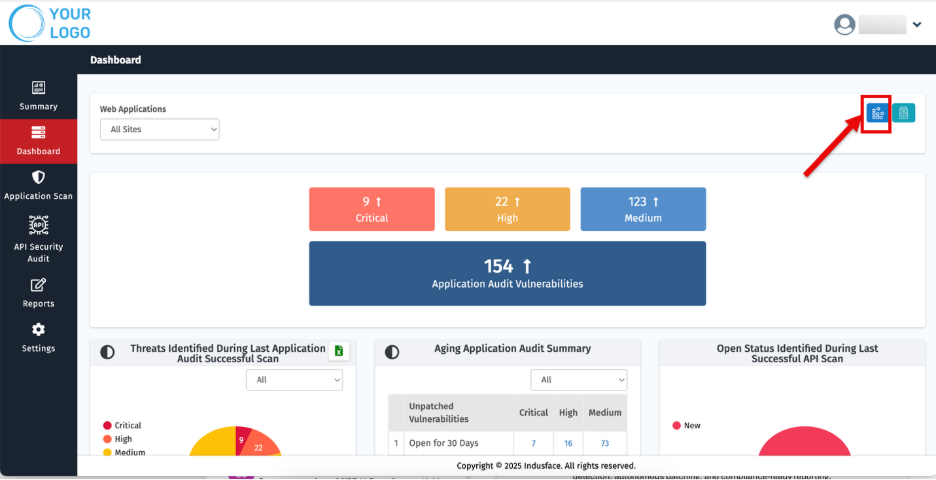
- The Add Components popup appears.
- Click to select one or more components. (e.g., Aging Summary, OWASP Summary).
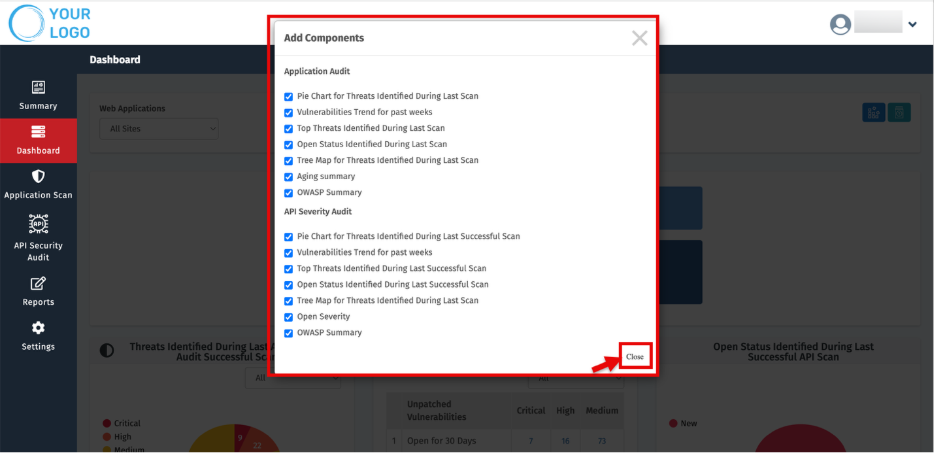
Click Close. The selected components are added to the client’s Dashboard view.
3. Remove Components
- Click Add Component.
- In the popup, unselect the component(s) you want to remove.
- Click Close. The Dashboard updates, reflecting the streamlined client view.
You can add multiple instances of components where supported, allowing MSSPs to tailor dashboards per client, ensuring each one gets the most relevant insights.
Widget Library (Available Components)
Availability depends on your subscriptions and the selected scope (All Sites vs. specific site).
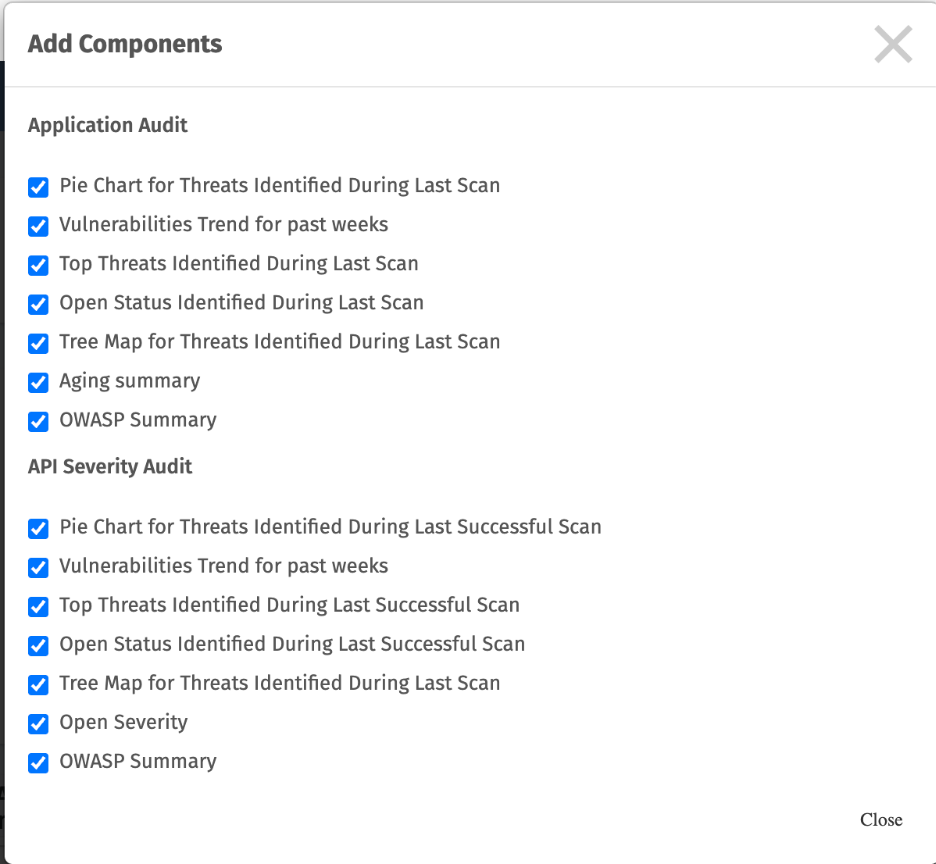
Application Audit
- Pie Chart — Threats Identified During Last Application Scan: Distribution of findings by severity in the most recent scan.
- Vulnerabilities Trend (Past Weeks): Weekly trend of discovered vulnerabilities to show improvement or regression.
- Top Threats — Last Scan: Highestimpact or most frequent threats identified in the last scan.
- Open Status — Last Scan: Breakdown of open vs. closed findings from the last scan.
- Tree Map — Threats Identified During Last Scan: Hierarchical visualization of threats clustered by type/severity.
- Aging Summary: Age buckets (e.g., open for 30 days, 90 days and 180 days) showing how long vulnerabilities have remained open.
- OWASP Summary: Findings mapped to relevant OWASP categories for quick standardsbased assessment.
API Severity Audit
- Pie Chart — Threats Identified During Last Successful Scan: Severity distribution based on the most recent successful API audit.
- Vulnerabilities Trend (Past Weeks): Weekly trend of API findings.
- Top Threats — Last Successful Scan: Most significant threats from the latest successful API scan.
- Open Status — Last Successful Scan: Open vs. closed API findings from the latest successful scan.
- Tree Map — Threats Identified During Last Scan: Clustered view of API threats by type/severity.
- Open Severity: Current open API findings by severity.
- OWASP Summary: API findings mapped to OWASP categories.
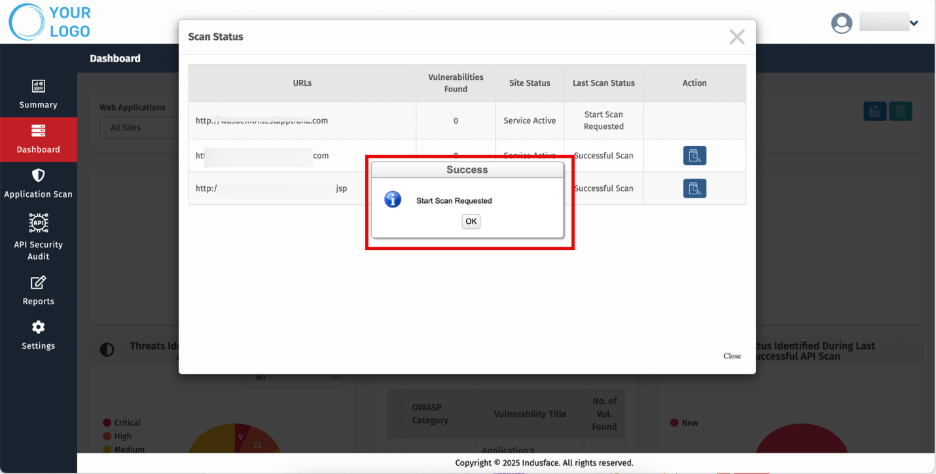
Scan Status
- Use Scan Status for quick visibility into scan activity and control.
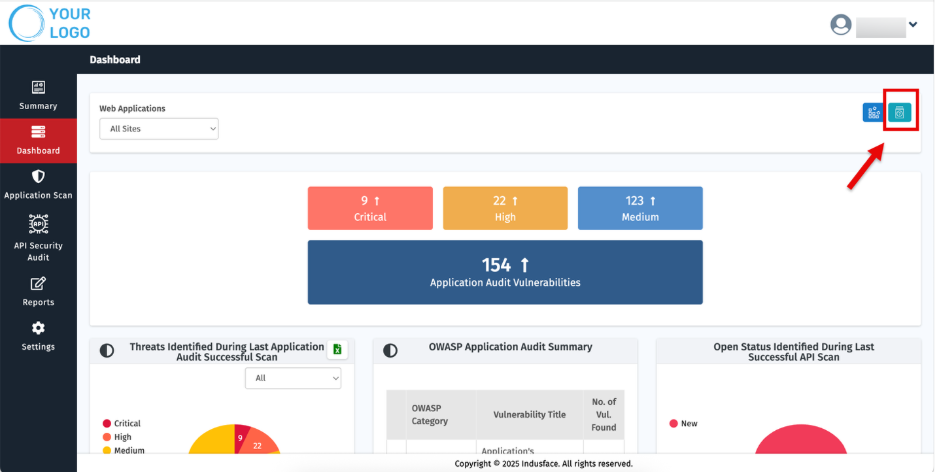
- Click the Scan Status button. The Scan Status popup appears.
- Review the grid.
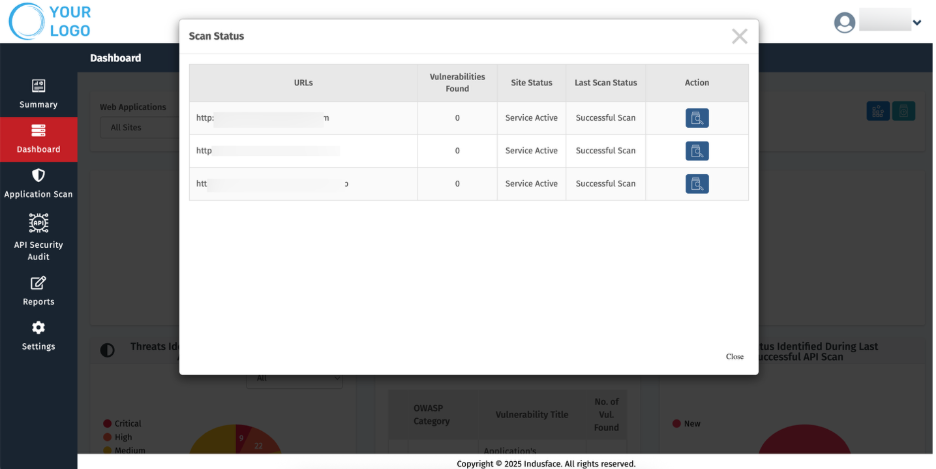
| Parameter | Description |
| URLs | Displays the website address under scan. |
| Vulnerabilities Found | Number of vulnerabilities identified. |
| Service Status | Indicates if the service is Active or Inactive |
| Last Scan Status | Shows the final state of the last scan |
| Action | Displays Start or Resume button depending on scan state. |
Actions
- Start a Scan: Click Start for the specific website.
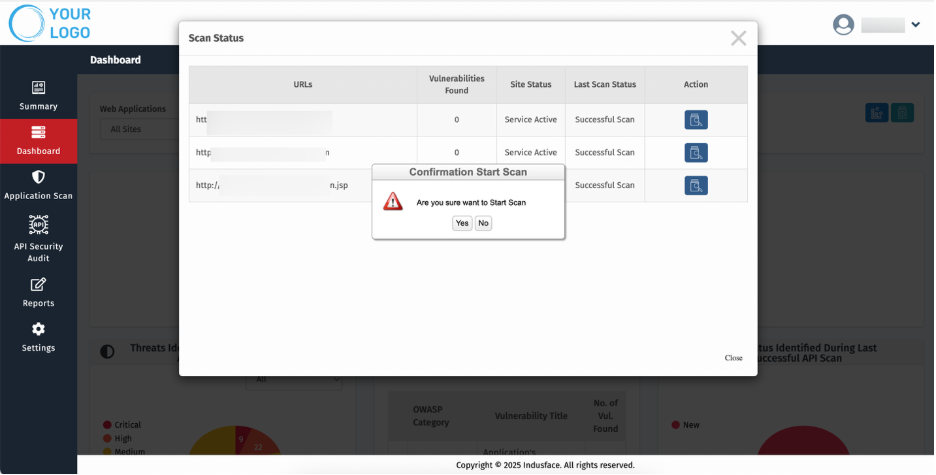
- Resume a Scan: Click Resume to continue a paused scan.
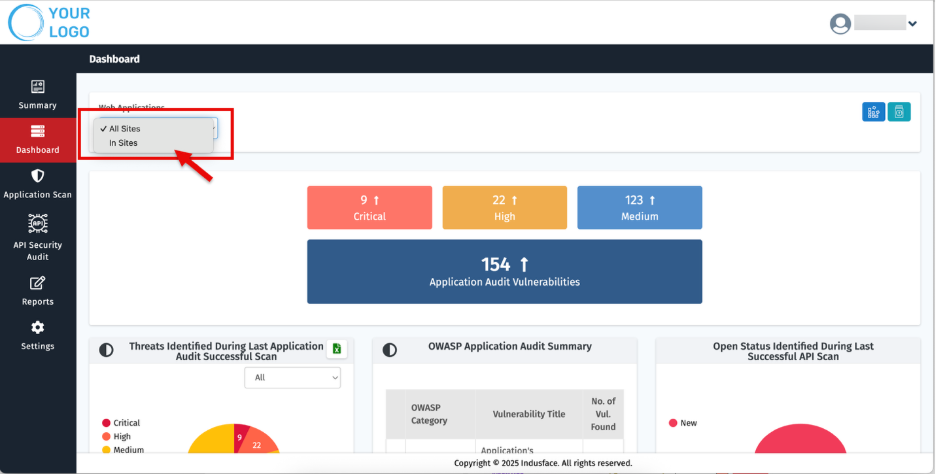
Filter by Web Applications
The Web Applications dropdown controls the scope of the Dashboard, enabling you to switch between an aggregated client view and site-level details.
- All Sites (Default): Aggregated view across all managed websites.
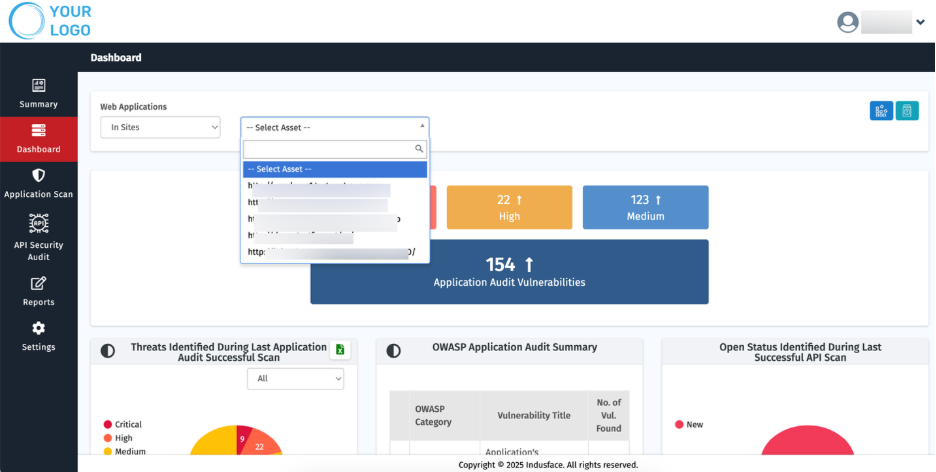
- In Site(s): View a specific site or group.
- Open the Web Applications dropdown and select In Site(s).
- Use the Select Asset dropdown to pick the target website
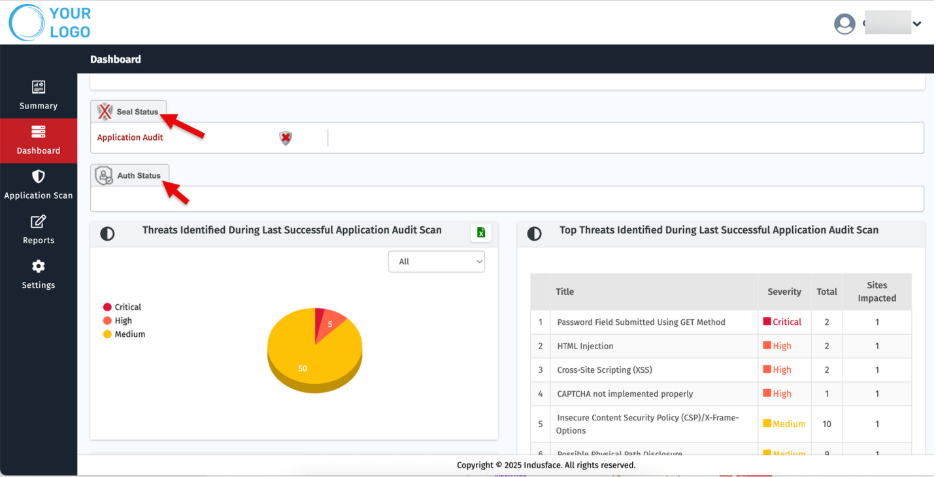
- Seal Status: Indicates whether the selected website currently meets the required security standards and can display the security seal. An Active Seal Status means the site has passed recent scans and is considered safe for end-users.
- Auth Status: Displays whether authentication has been successfully set up and validated for the selected website. An Authenticated status confirms that authenticated scans are running with valid credentials for deeper coverage.
- Widgets: Reflect findings and activity for the chosen scope, showing vulnerabilities, trends, and compliance summaries specific to that site.
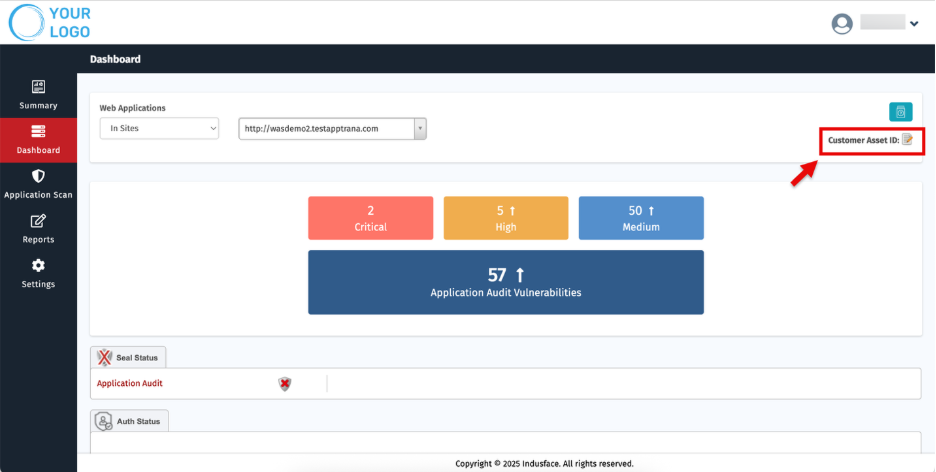
Customer Asset ID
Managing multiple clients and websites can be complex. Customer Asset IDs provide MSSPs with short, unique labels for quick identification and streamlined reporting.
Set or Update Customer Asset ID
On the site’s Dashboard, click the Edit icon next to Customer Asset ID. The Edit Customer Asset ID popup appears.
Enter a meaningful name (e.g., StorefrontINProd).
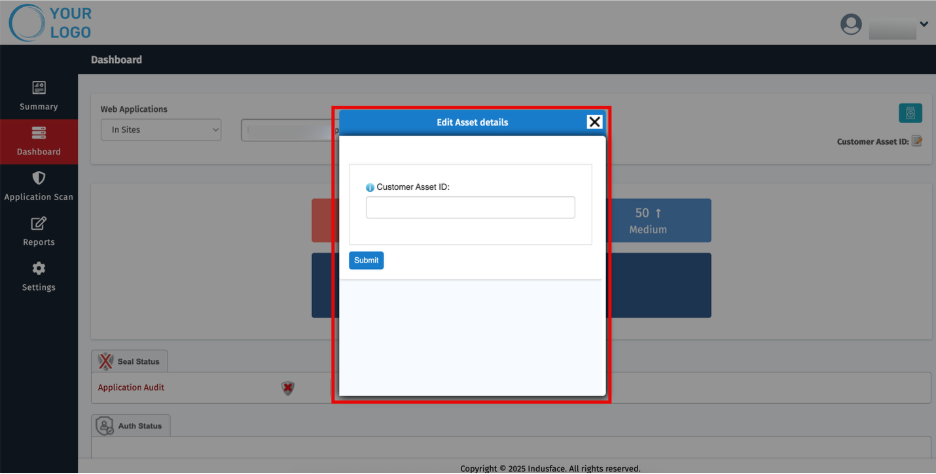
- Click Submit.