
AppTrana Dashboard
Overview
The Dashboard section provides a summary of key metrics, including Protection Status, Attack Trend, Vulnerability Trend, Suggested Actions, and Previous Actions. Each section also includes a navigation for easy access to detailed, end-to-end information.
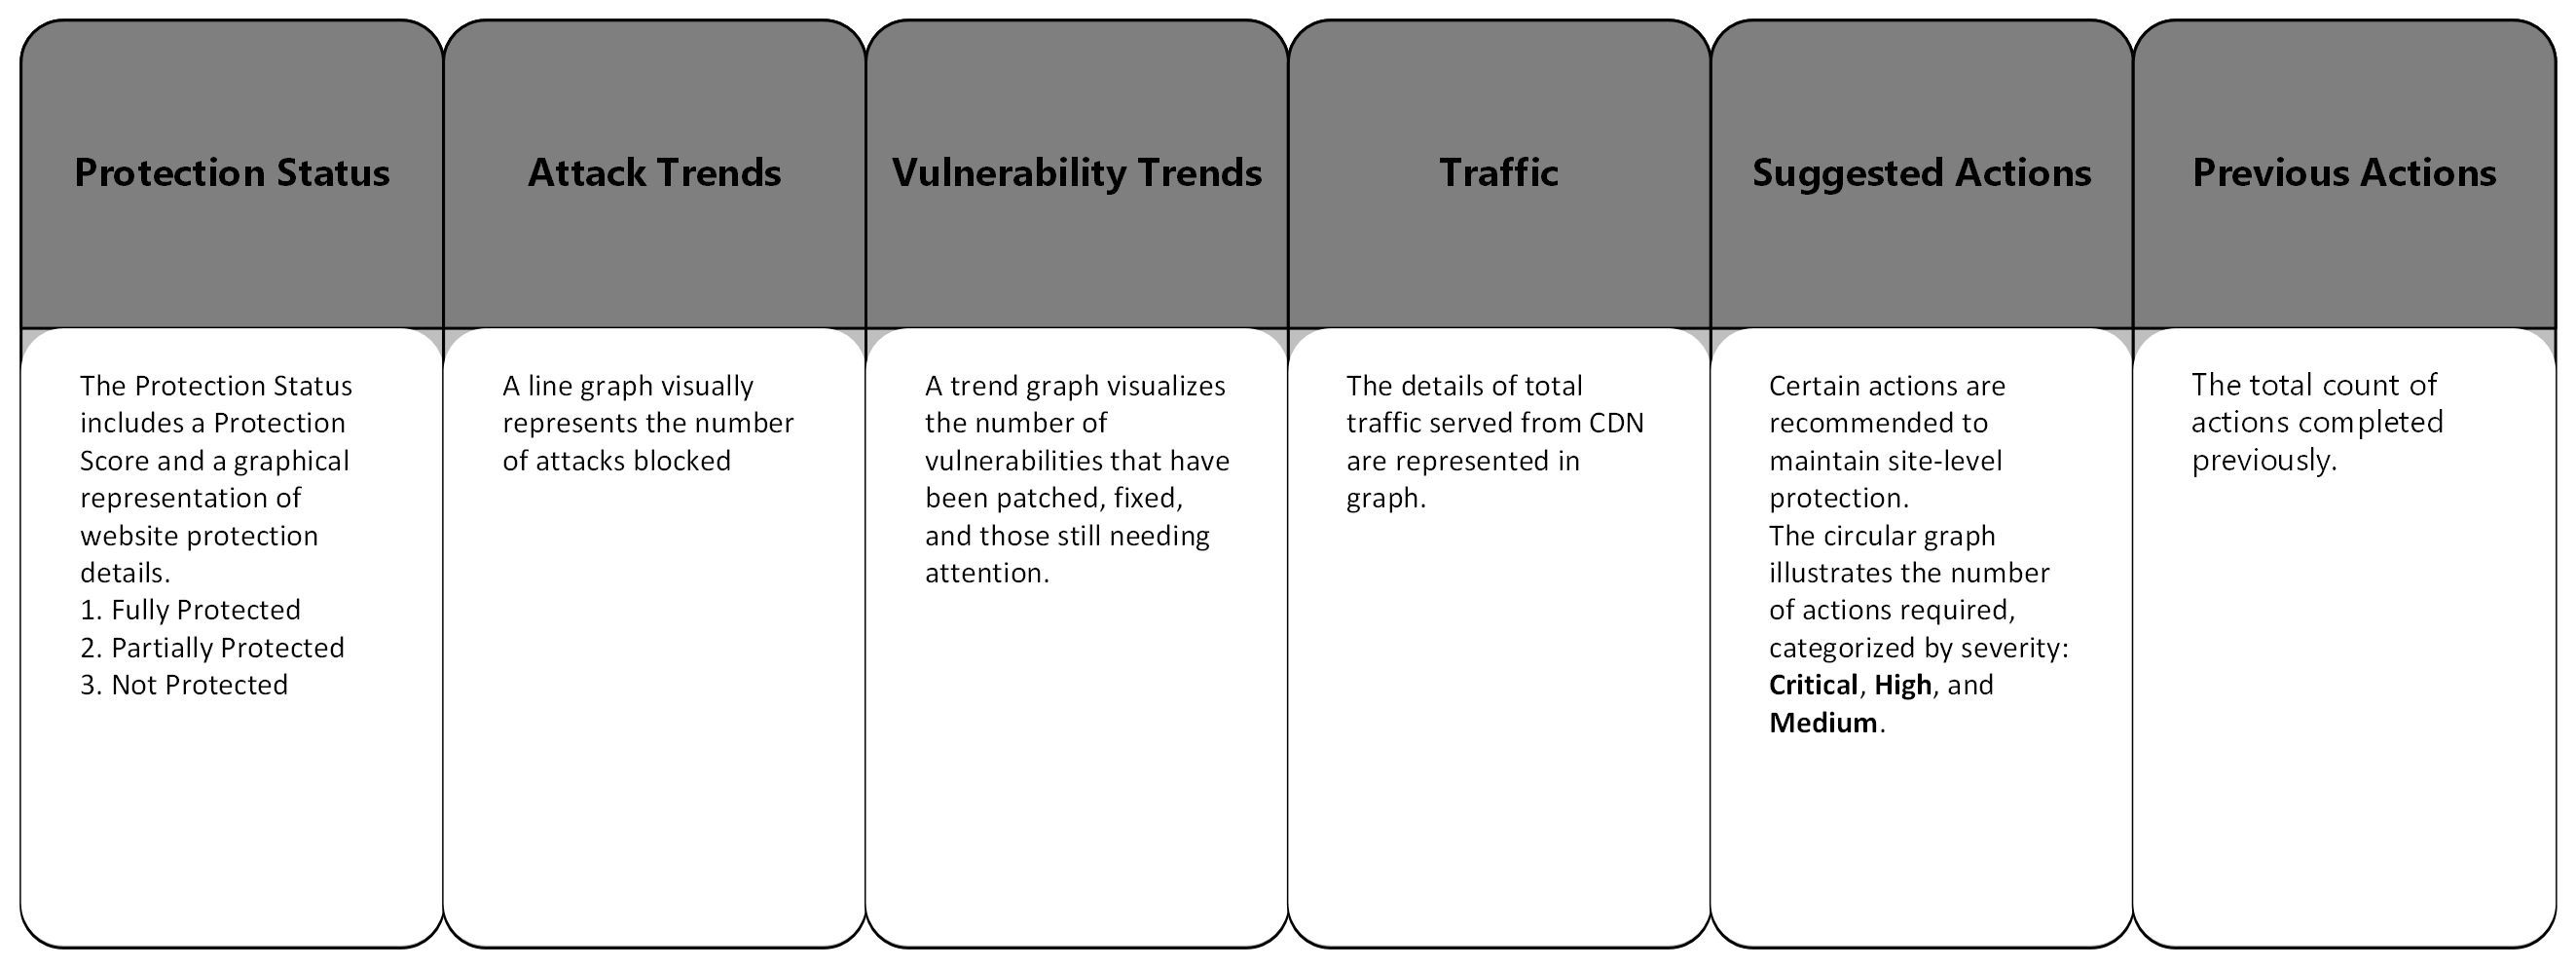
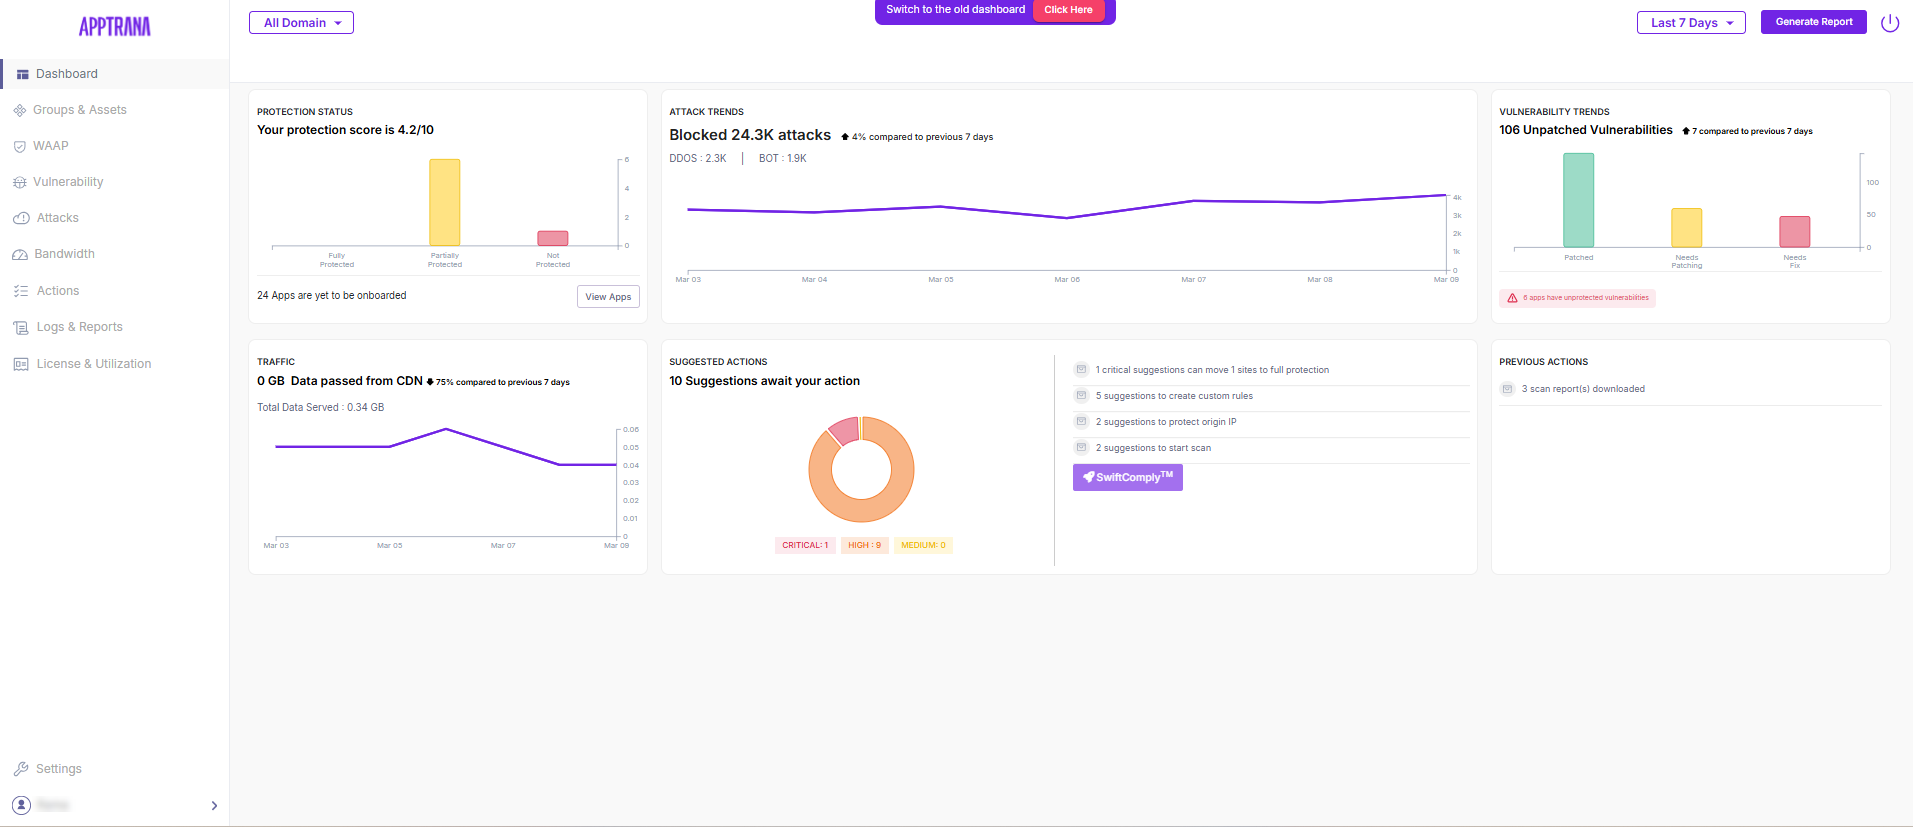
Protection Status
We differentiated protection status into three categories with three distinct legends.
Green- Fully protected
Yellow- Partially protected
Red- Not protected
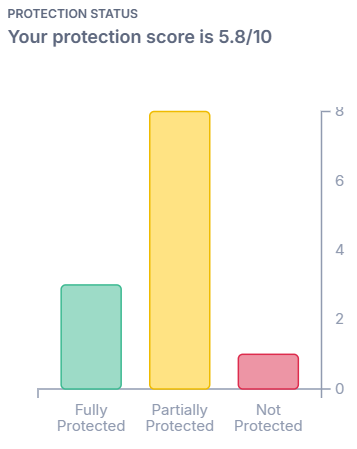
Protection status includes protection score and protection level.
Click here to understand more about the Protection Status.
Attack Trends
Attack Trend shows the number of attacks blocked, including DDoS and bot attacks. It also allows customers to compare the percentage of attacks blocked this week to those blocked last week or last month.
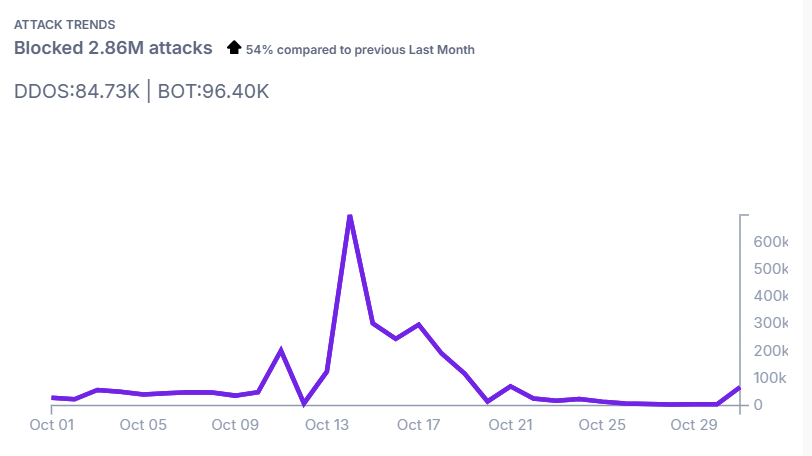
Click Attack Trends to see more details and automatically navigate to Attack Status page.
Vulnerability Trends
This trend shows the number of patched and unpatched vulnerabilities, as well as those that require a fix.
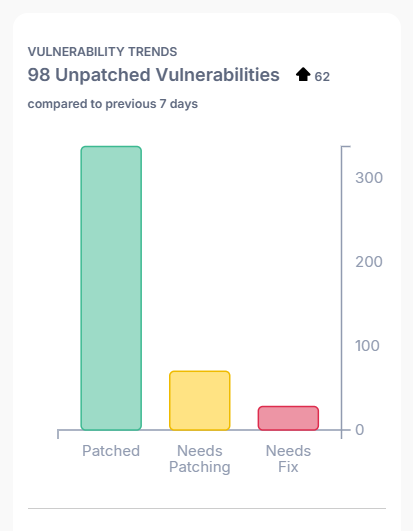
Click Vulnerability Trends to see more details and automatically navigate to Vulnerability Status page.
Traffic
This graph shows the total data served. The total data served through CDN is displayed above the graph.

Click Traffic to see more details, and automatically navigates to Bandwidth page.
Suggested Actions and Previous Actions
All the pending action associated with the account and action severity are displayed in the suggested action section.
All the suggested actions applied previously are displayed in the Previous Actions section.
Click Suggested Actions or Previous Actions to navigate to Action center and find more details on Actions.
The graph shows the number of critical, high, and medium severity actions pending.
