API Security Audit
1. Self-Onboarding API Host
MSSPs can onboard APIs for scanning either through self-service or with assistance from the Indusface Support Team.
APIs are available as an add-on to the MSSP license.
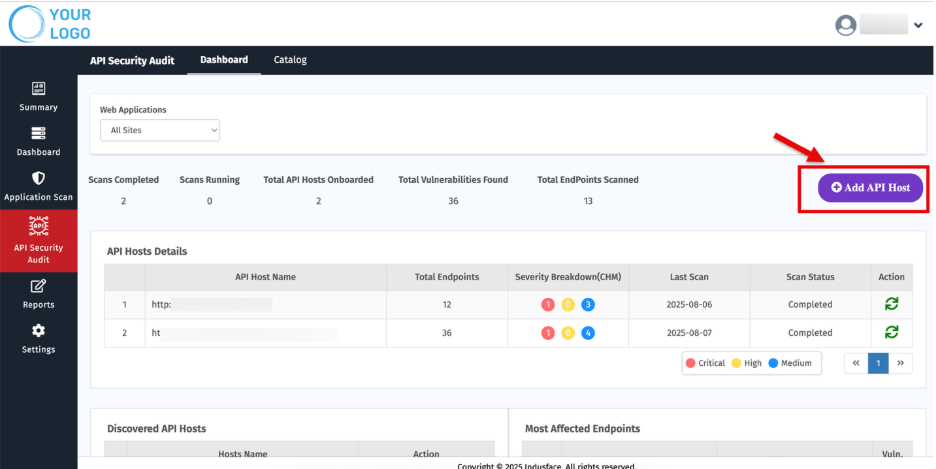
2. Click “Add API Host.”
3. Select your license. You will also be notified with the following details:
- Total licenses available
- Remaining licenses
- License expiry date
- Applicable promo codes for adding
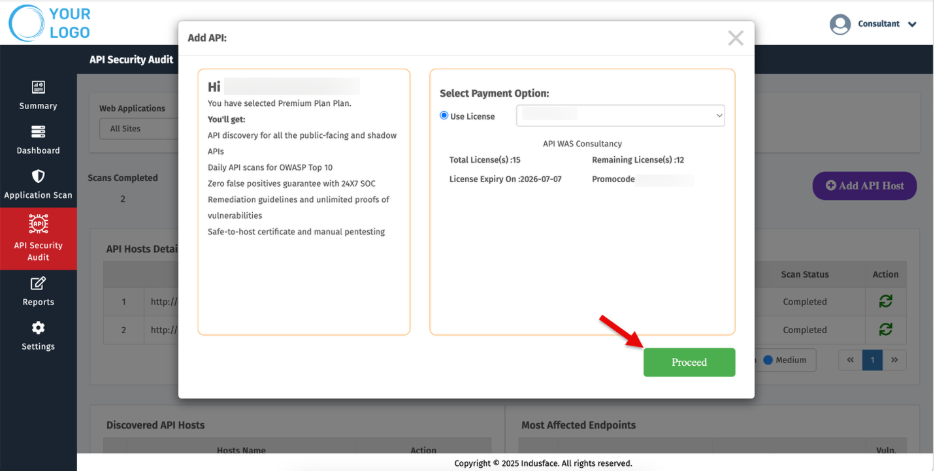
4. Click Proceed.
Enter API Details
5. Enter the API URL in the respective field.
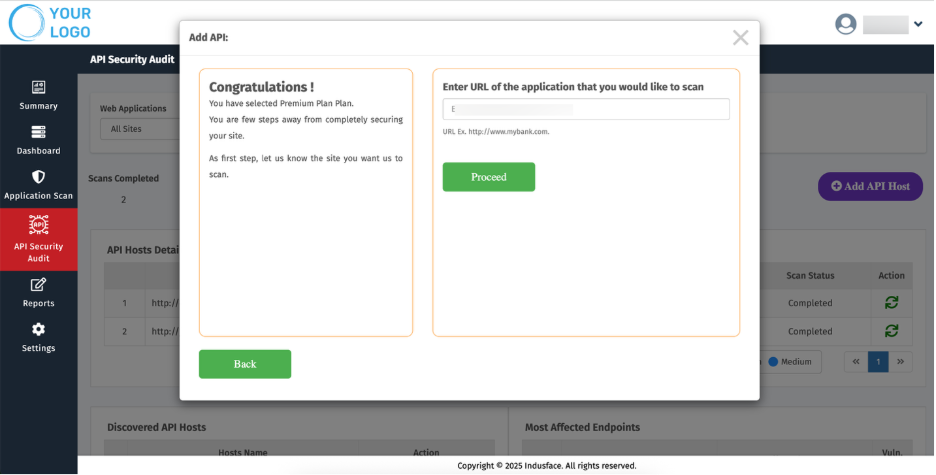
6. Click Proceed.
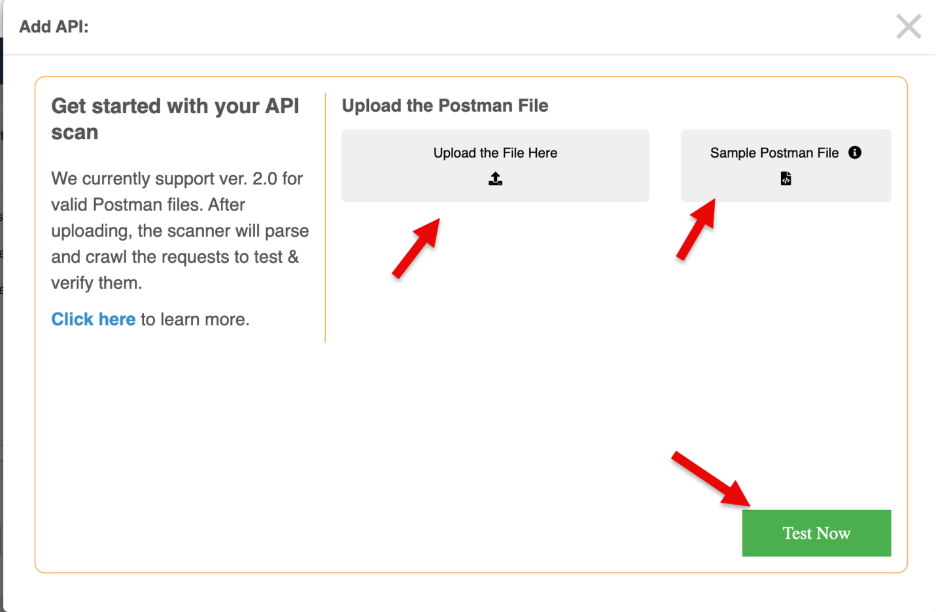
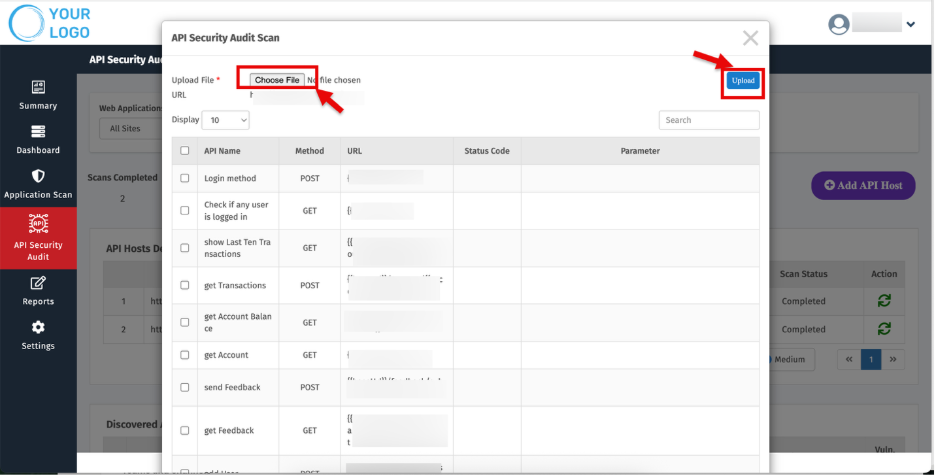
Upload Postman File
7. Upload your Postman file.
A sample API file is provided to help you understand the required JSON structure.
8. The maximum file size allowed is 10MB.
9. Click Test Now.
Review Uploaded File
10. Once the Postman file is uploaded successfully, you will be redirected to a new page.
11. This page displays the basic information from the Postman file along with required inputs to initiate the scan.
Start the Scan
12. Click Start Scan.
13. You will be redirected to the API Security Dashboard, where you can monitor scan results and details.
2.Dashboard
Dashboard provides a complete view of your onboarded APIs, their scan status, vulnerabilities, and trends.
1. Overview
The Top section provides a quick snapshot of API security activities and scan results.
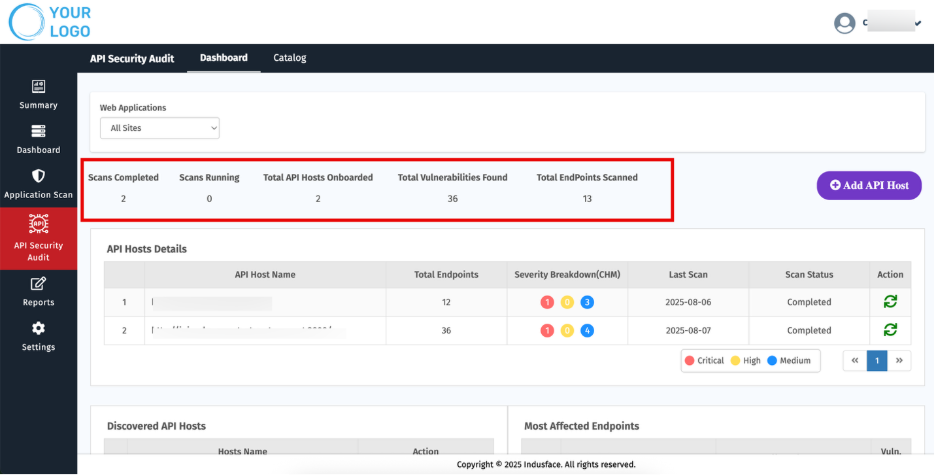
Metric | Description |
| Scans Completed | Number of scans successfully finished. |
| Scans Running | Ongoing scans currently in progress. |
| Total API Hosts Onboarded | APIs that have been added for scanning. |
| Total Vulnerabilities Found | Total count of vulnerabilities detected across all scans. |
| Total Endpoints Scanned | Number of endpoints covered during the scans. |
2. API Host Details
This section displays all onboarded API hosts with key information for quick reference.
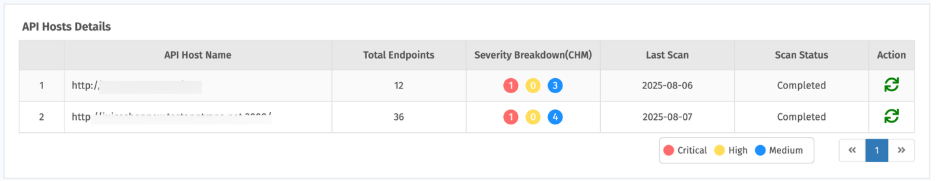
Parameter | Description |
| API Host Name | Name of the onboarded API host. |
| Total Endpoints | Number of endpoints associated with the host. |
| Severity Breakdown (CHM) | Distribution of detected vulnerabilities by Critical, High, and Medium. |
| Last Scan | Date when the most recent scan was performed. |
| Scan Status | Indicates whether a scan is pending, in progress, or completed. |
| Actions | Options to Start Scan the host. |
Steps to Initiate a Scan for a Host
- Click the Start Scan icon.
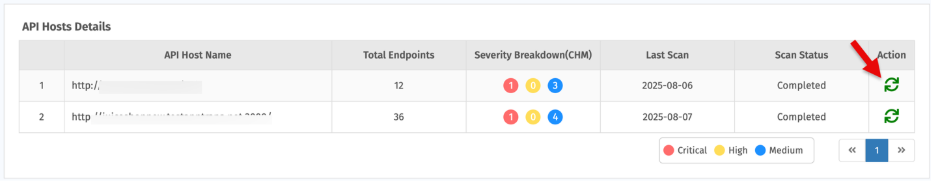
- Upload the Postman file.
- Click Upload, then select Start Scan.
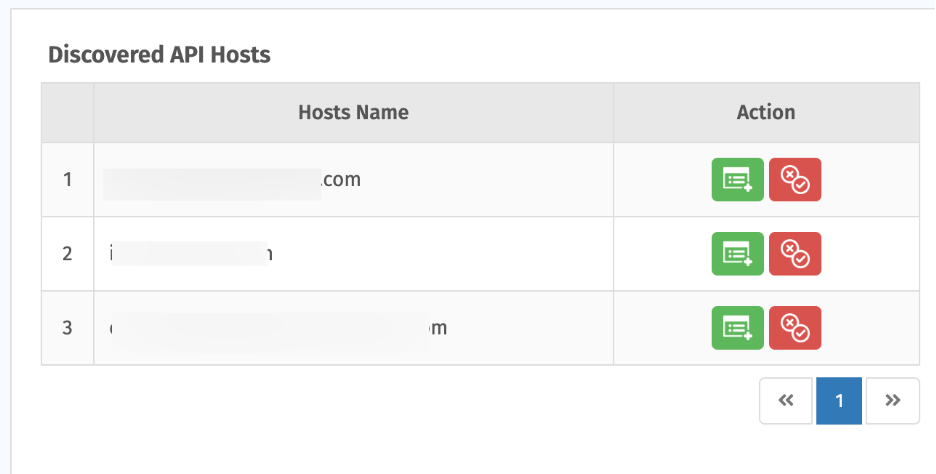
3. Discovered API Hosts
Displays API hosts identified but not yet onboarded. You can:
- Add for Scan — onboard and start scanning.
- Mark as False Positive — remove items not in scope.
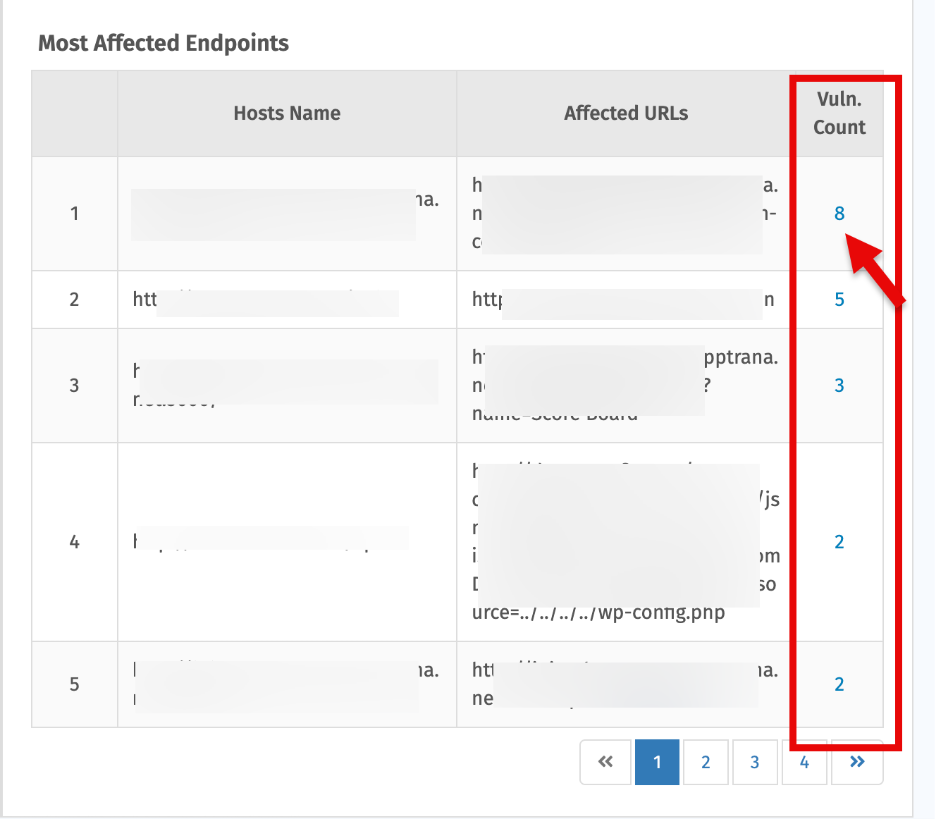
4. Most Affected Endpoints
- Shows endpoints with the highest vulnerability counts

- Click the vulnerability count to open a summary of detailed findings.
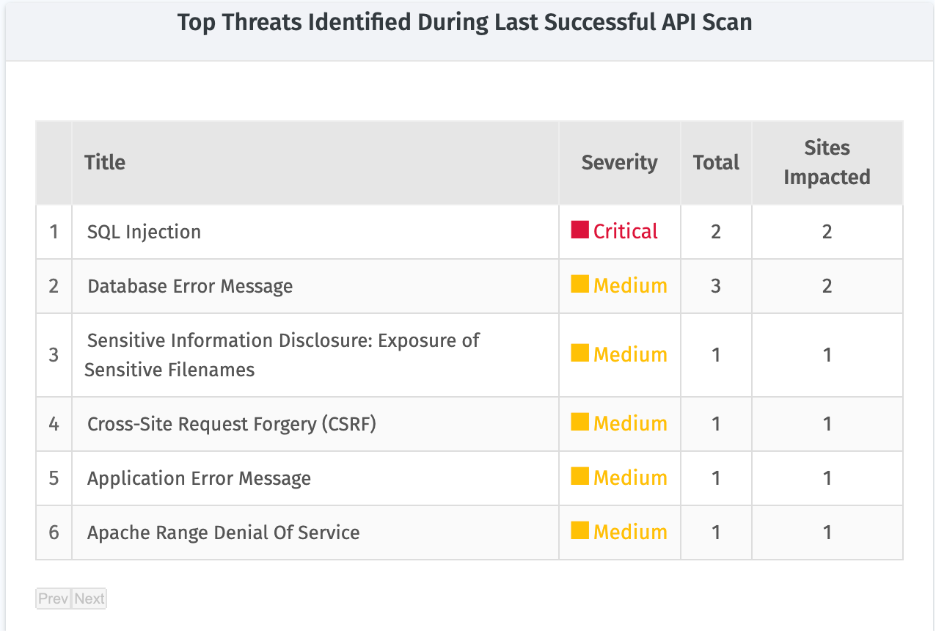
5. Top Threats Identified During Last Successful Application Audit Scan
Shows the top vulnerabilities from the latest successful scan, with details on severity, occurrence, and impacted sites
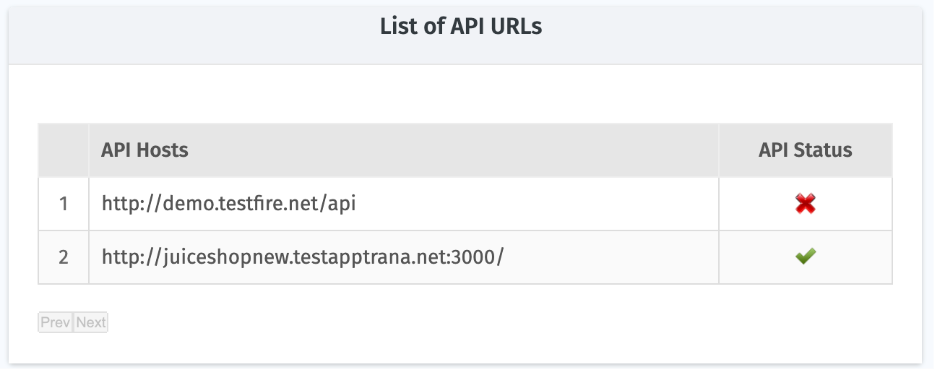
6. List of API URLs
Shows API hosts with their associated endpoints and scan statuses
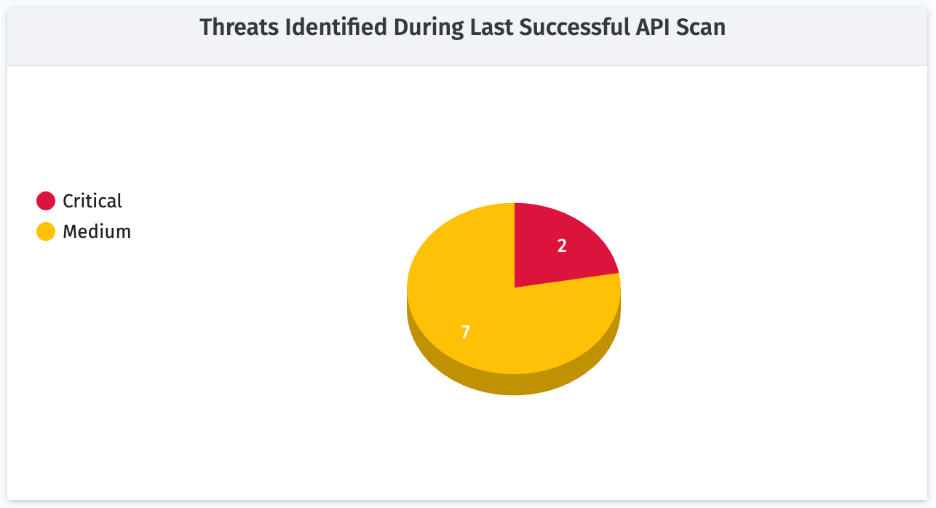
7. Threats from Last Successful API Scan
A pie chart showing vulnerabilities grouped by severity detected in the most recent successful scan.
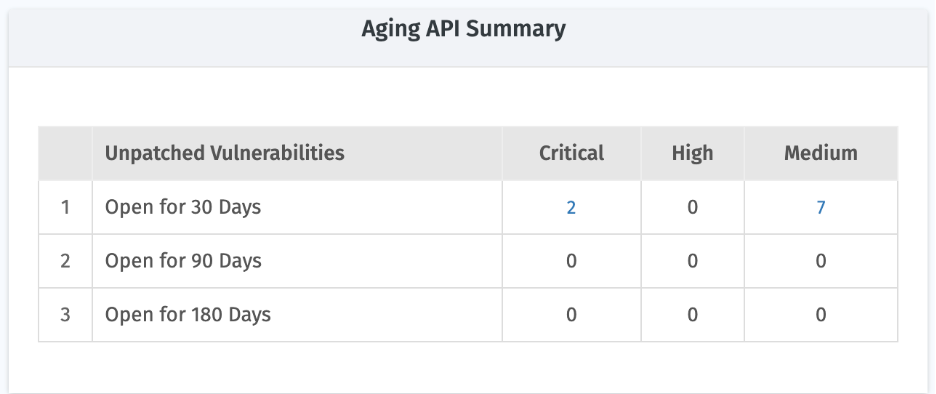
8. API Aging Summary
Breaks down unpatched vulnerabilities based on how long they have remained open:
9. Vulnerability Trends for Previous Weeks
Weekly view showing how vulnerabilities have changed over time. Useful for tracking remediation progress.
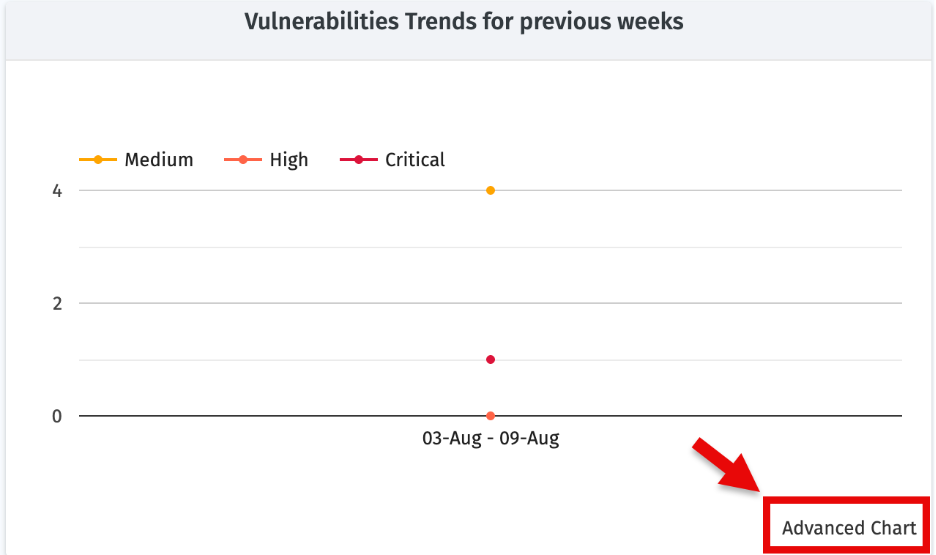
Click Advanced Chart for for deeper analysis and report generation.
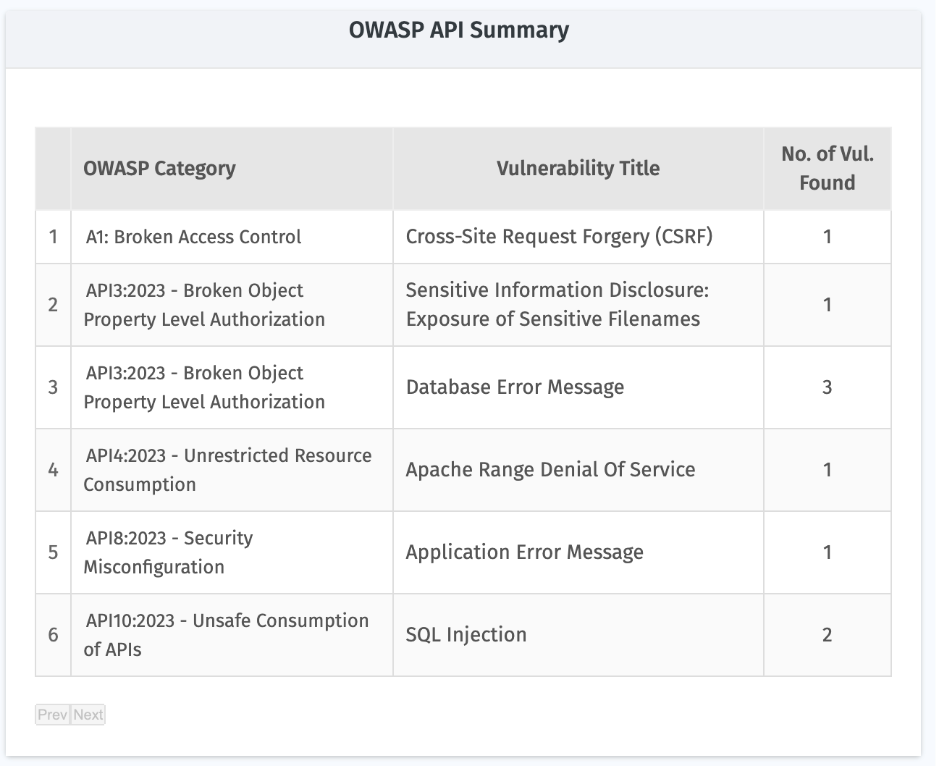
10. OWASP API Summary
Maps detected vulnerabilities against the OWASP API Top 10 categories. Helps align fixes with industry-recognized best practices and compliance needs.
Selecting and Viewing Detailed Audit Details
The Indusface WAS MSSP platform allows you to select a specific API to view detailed audit results, analyze vulnerabilities, and share the findings with your customers.
Navigate to Select In Sites (All Sites by default).
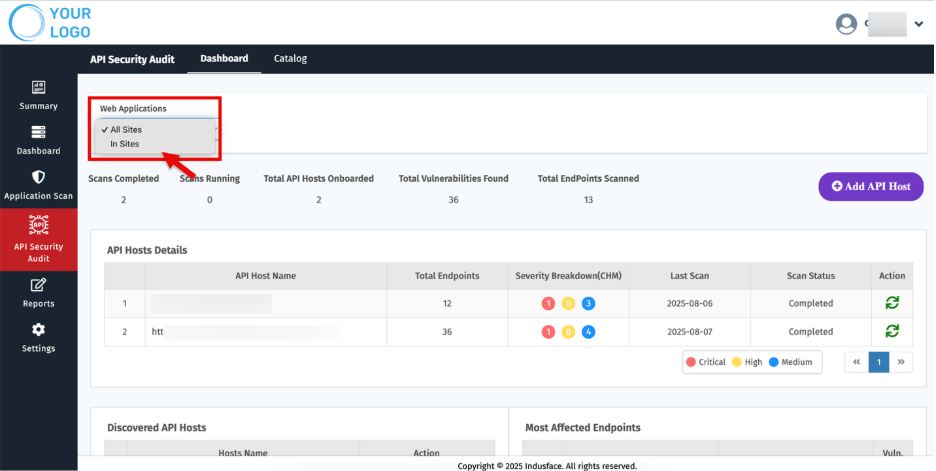
- Choose the relevant Asset you want to review.
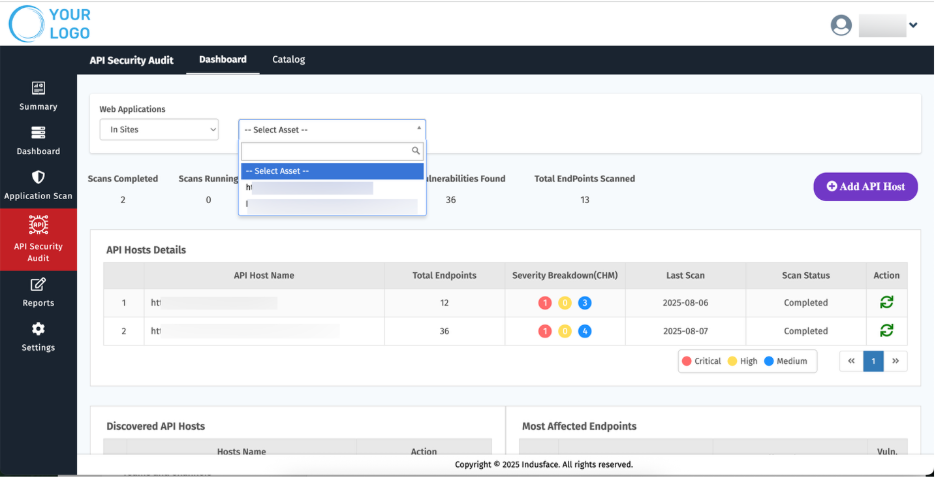
- Once selected, the platform displays all relevant API security audit details and scan history for that API.
For example:
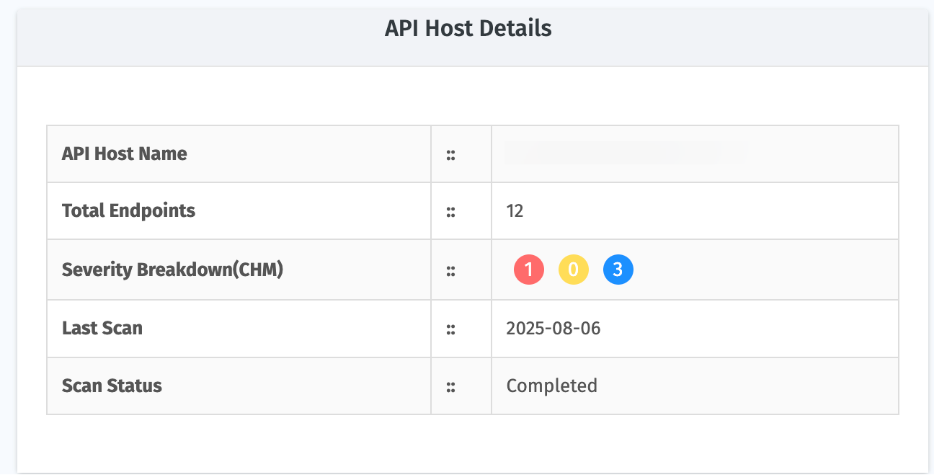
API Host Details
- Shows general details about the selected application and audit scope.
Scan API Summary
- Provides a consolidated view of automated scans, including severity, total vulnerabilities, and scan type.
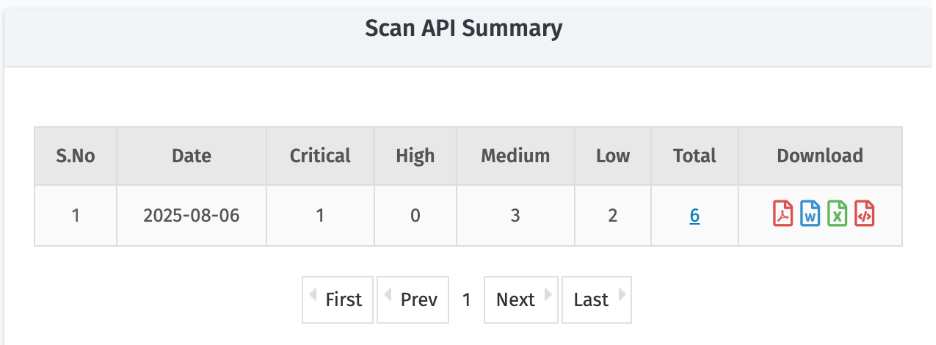
Parameter | Description |
| Date | Scan date |
| Critical / High / Medium / Low | Number of vulnerabilities categorized by severity |
| Total | Overall number of vulnerabilities detected |
| Download | Different formats available for report export
|
- To know more about identified vulnerabilities, Click the total count of vulnerabilities for a particular API scan.
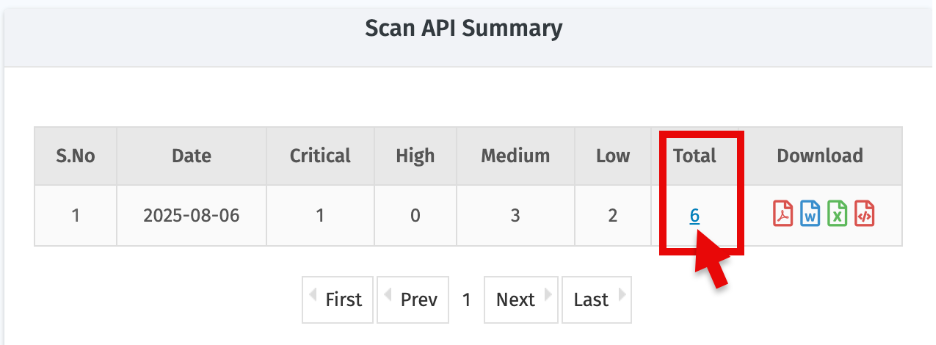
- A detailed list of vulnerabilities will open:
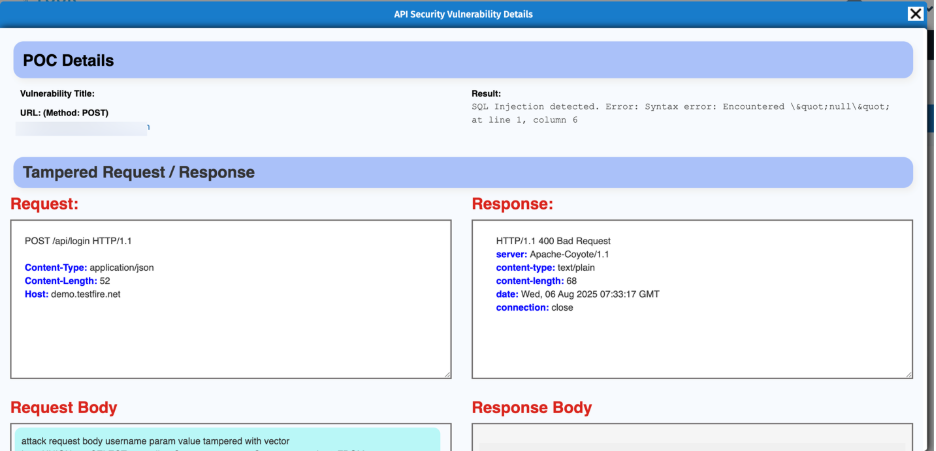
- Click 'Show more' to view additional details, including evidence such as tampered requests and responses
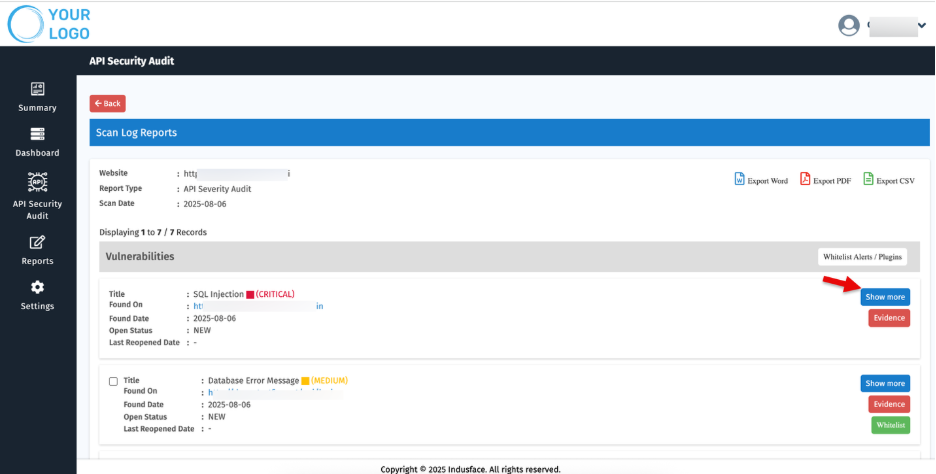
- These are generated automatically by the PoC tool and verified by our Managed Security Team, ensuring zero false positives.
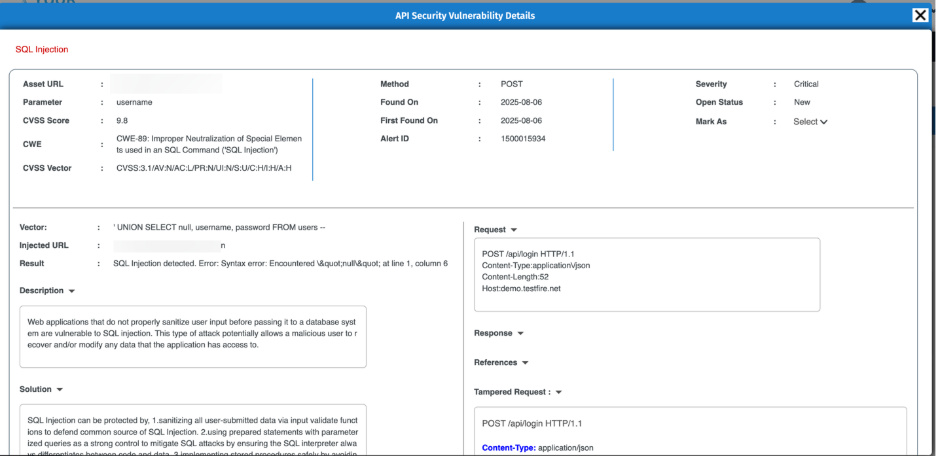
- Click the ‘Evidence’ to understand why the vulnerability is marked as valid, supported by automated proof-of-concept and tampered request/response data.
- Whitelisting Options – You can whitelist alerts or plugins if required.
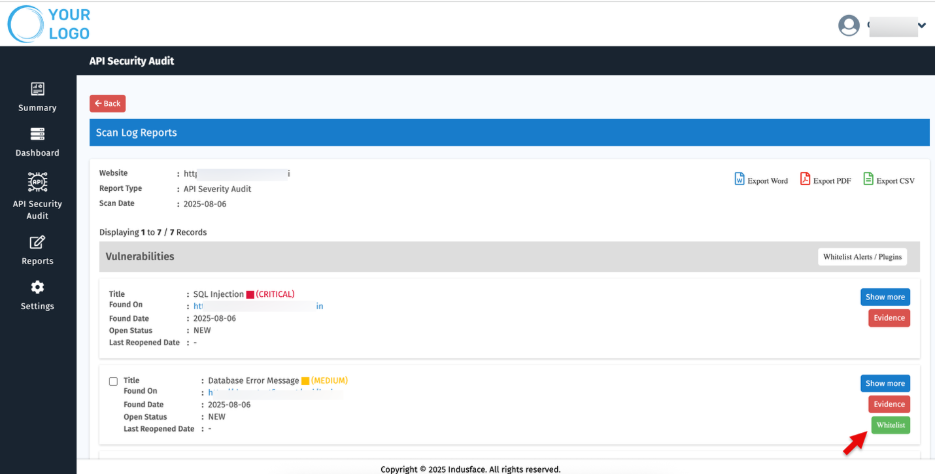
Vulnerabilities with Critical severity cannot be whitelisted.
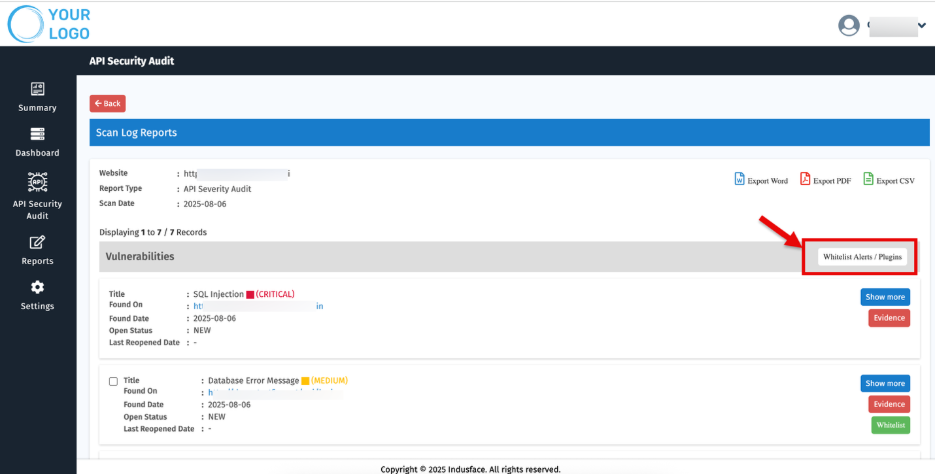
- Select Multiple vulnerabilities and use 'Whitelist Alerts/ Plugins” to whitelist them in bulk.
Quick Access: Initiate API Scans
Use the ‘Scan Now’ option to initiate a scan for the selected APIs.

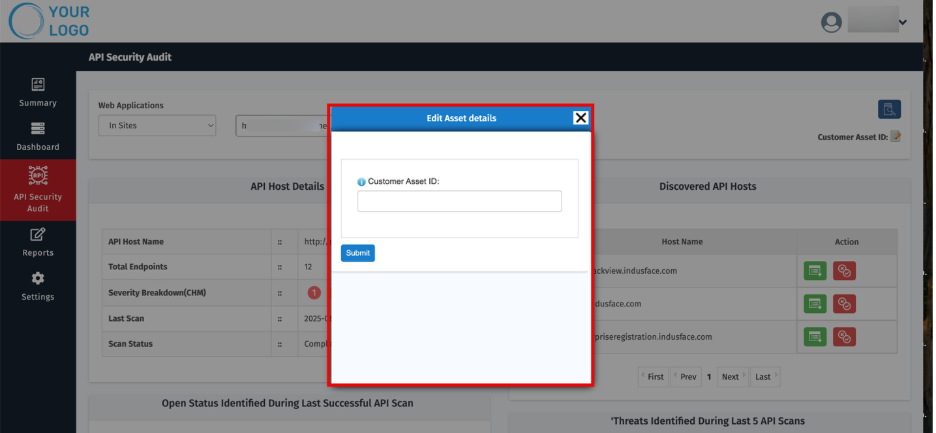
Customer Asset ID
Managing multiple clients and websites can be complex. Customer Asset IDs provide MSSPs with short, unique labels for quick identification and streamlined reporting.
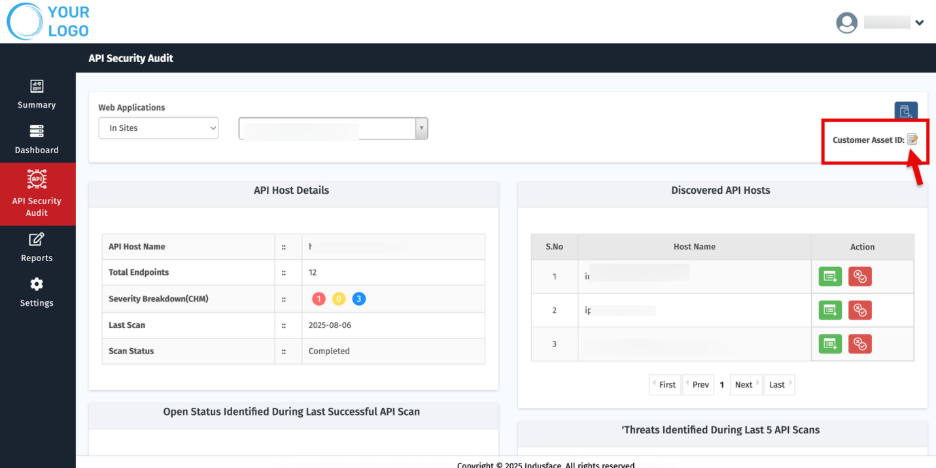
Set or Update Customer Asset ID
- On the site’s Dashboard, click the Edit icon next to Customer Asset ID. The Edit Customer Asset ID popup appears.
- Click Submit.
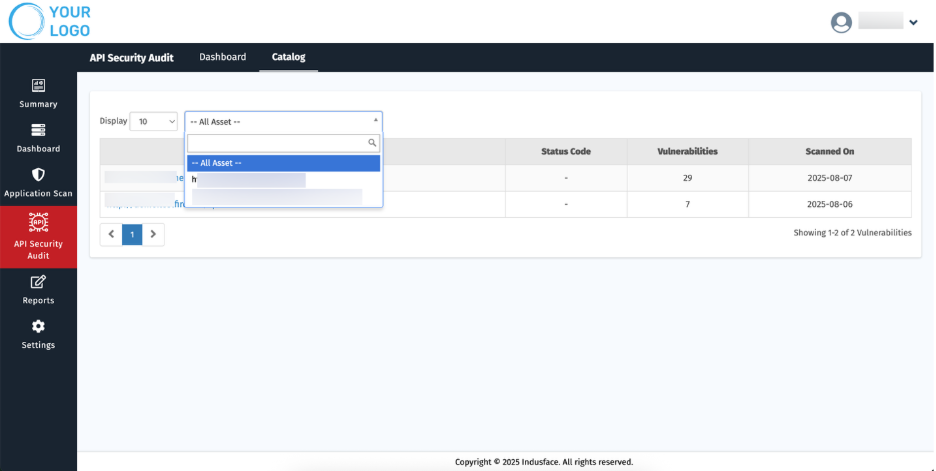
3. Catalog
This section provides information about the onboarded API hosts, their scan results, and also displays the endpoints specific to each API host.
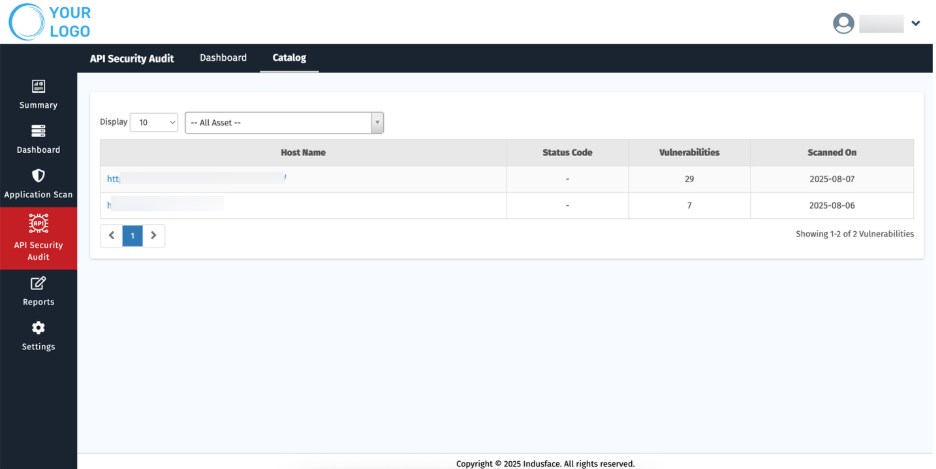
Parameter | Description |
| Host Name | Displays the name of the onboarded API host. It also includes each scanned endpoint and the associated API request HTTP method. |
| Status Code | Shows the HTTP response code returned during the scan. |
| Vulnerabilities | Indicates the total number of vulnerabilities identified. |
| Scanned On | Displays the date when the API scan was performed. |
The dashboard allows you to filter the displayed information based on your preference:
- All Assets – View details of every onboarded asset in a consolidated view.
- Specific Asset – Use the dropdown menu to select a particular asset and view its individual scan details.