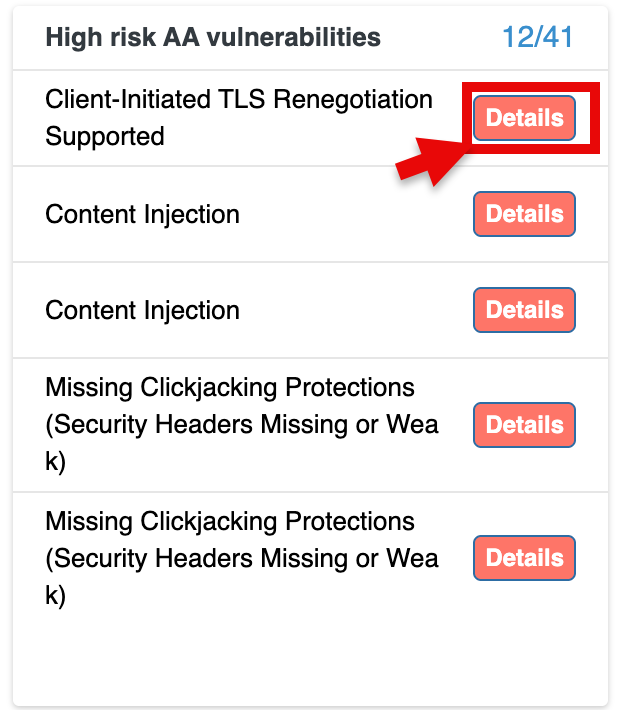
Summary
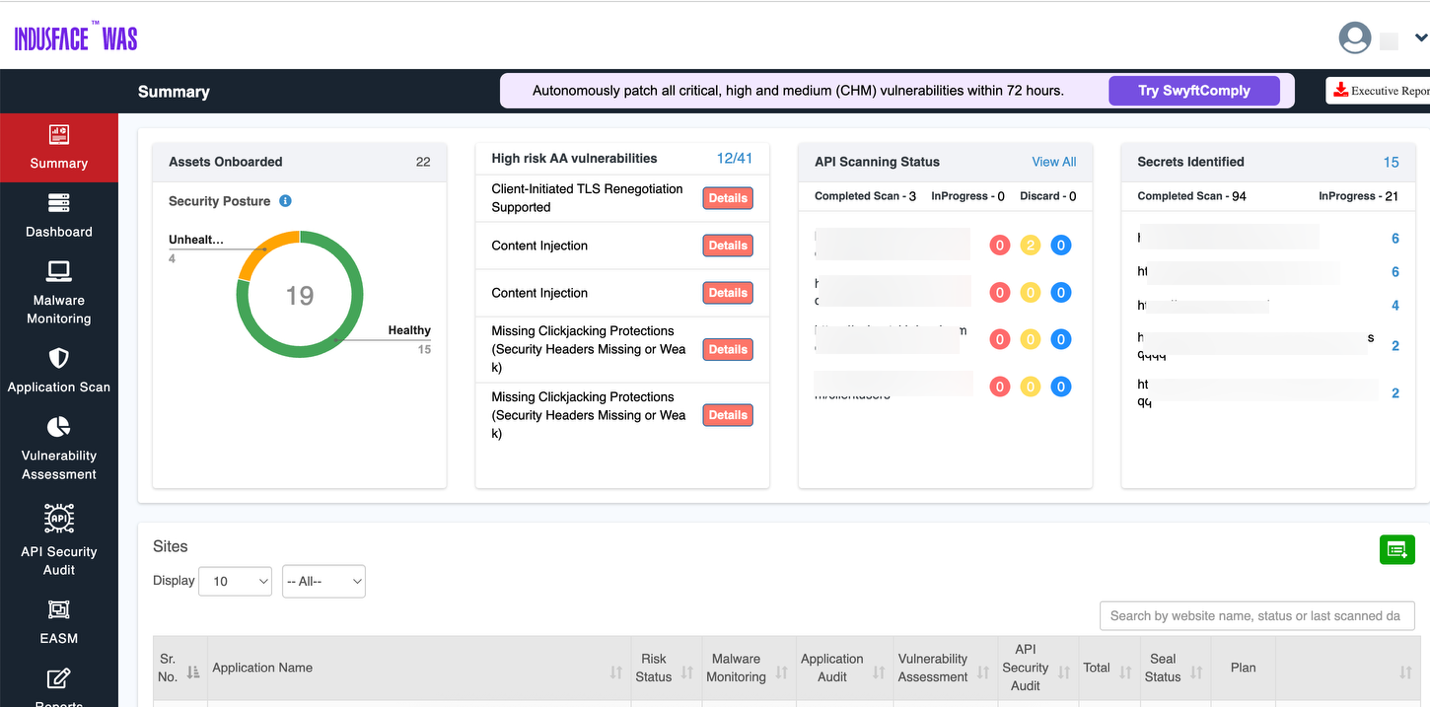
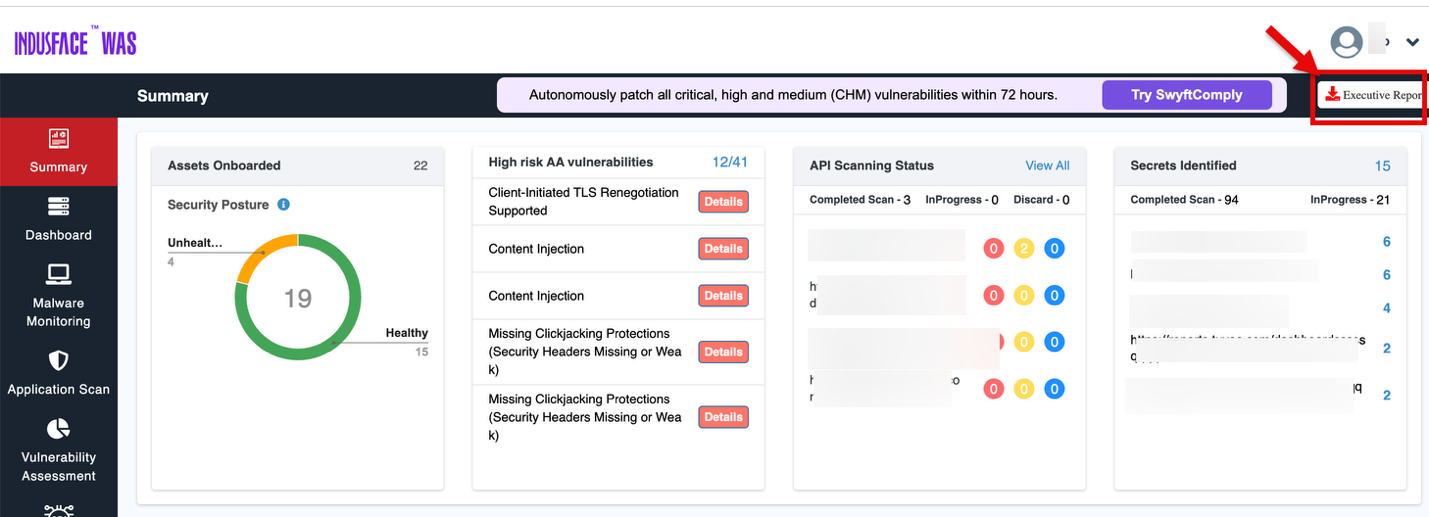
The Summary section provides a summary of the current security posture, the most pressing vulnerabilities, API scanning statuses, and identified secrets.
- Login to Indusface WAS portal
- Navigate to Summary section
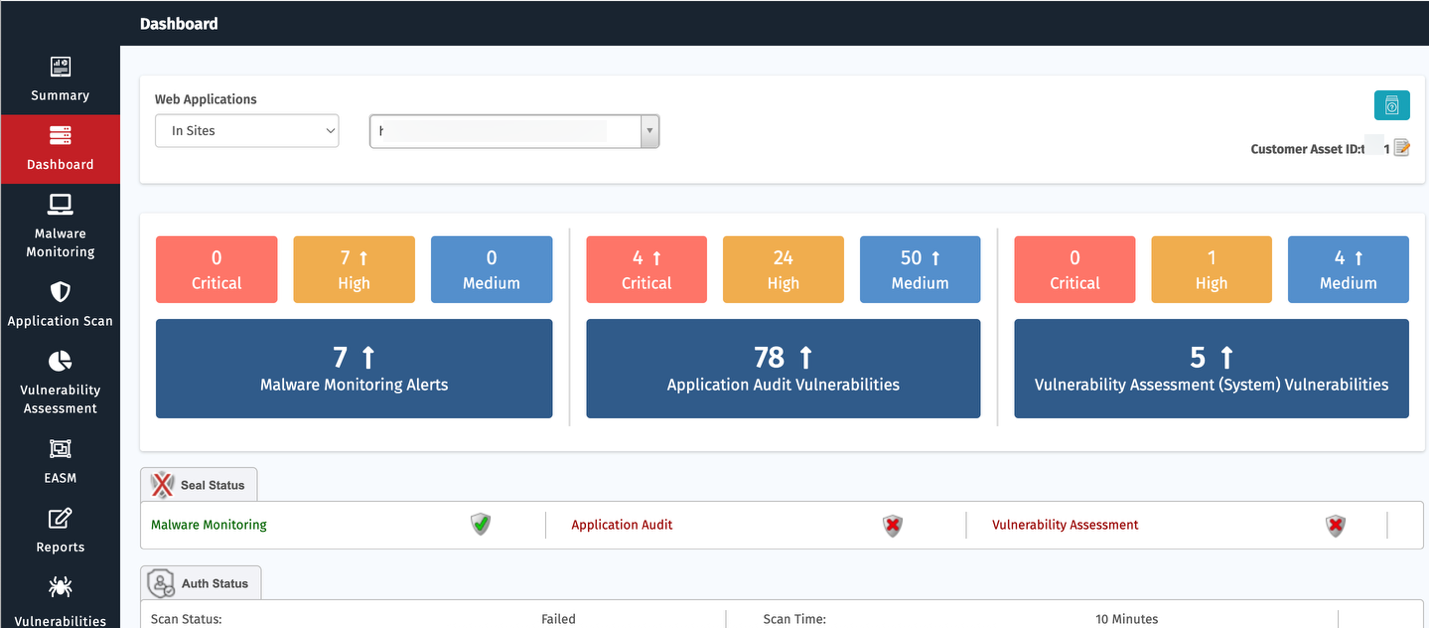
Security Posture Overview
Assets Onboarded
Displays the number of assets onboarded and tracked by the system.
The chart indicates how many of your assets are in a healthy state vs. potentially insecure or in need of attention. The health status is represented by a gauge with color indicators (green for healthy, yellow for unhealthy, and red for exposed).
| Asset Health Status | Description |
| Exposed | Any Assest that has Critical Vulnerbaility + High Risks as per AcuRisQ Algorithm |
| Unhealthy | Any Assest that has Critical/high/Medium Vulnerability that need attention as per AcurisQ Algorithm |
| Healthy | Any asset that has no Critical/High/Medium Vulnerability & no High Risk as per AcuRisQ Algorithm |
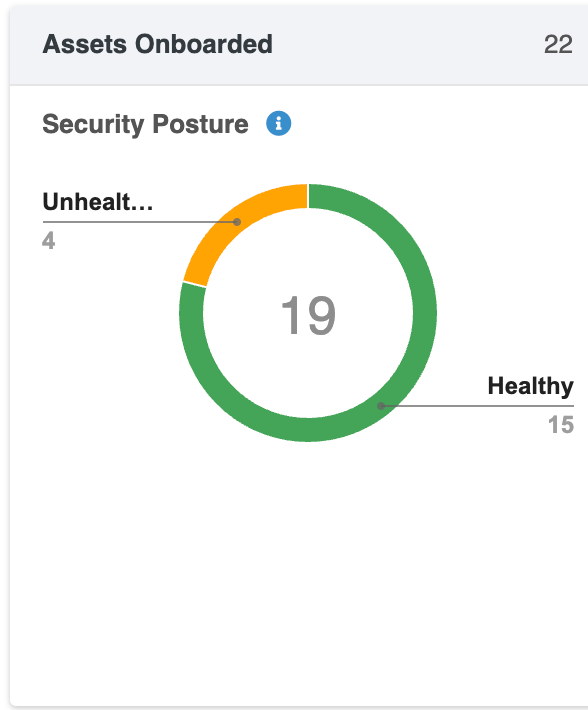
High Risk AA Vulnerabilities
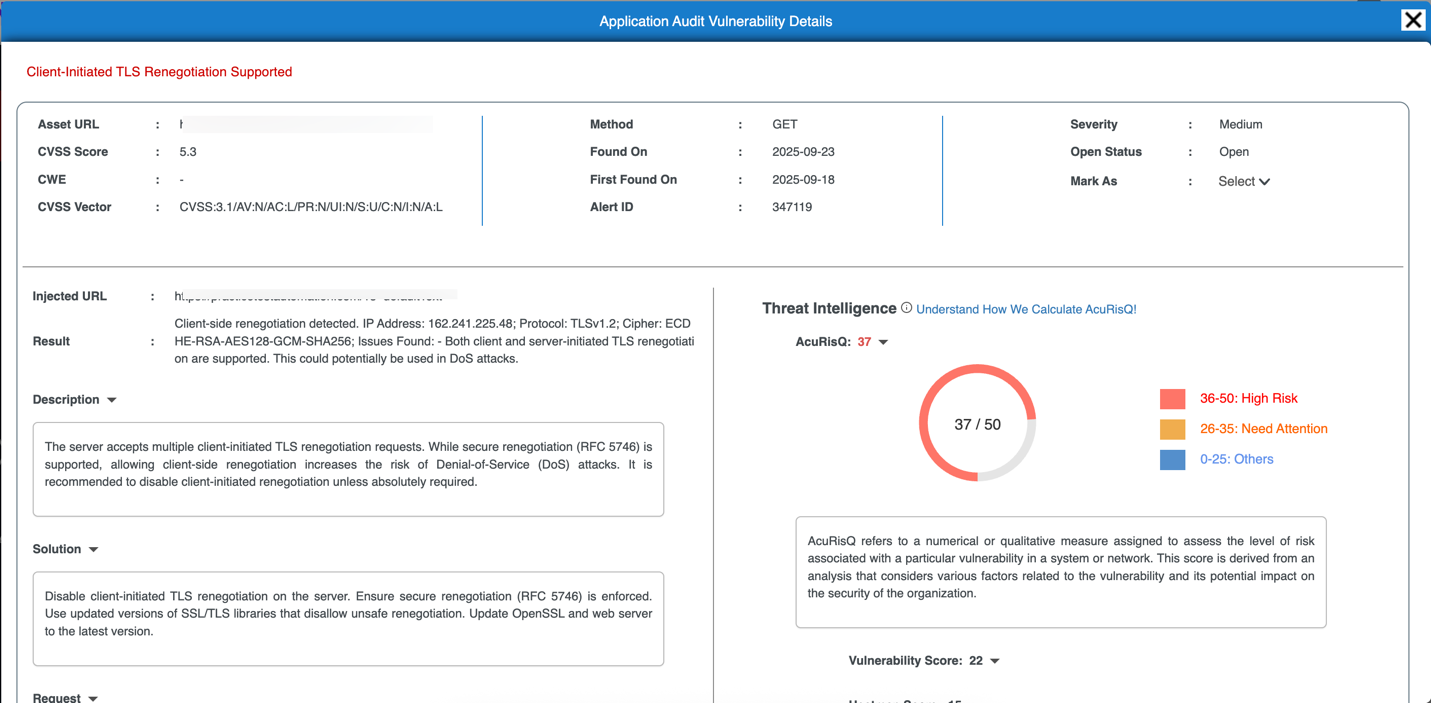
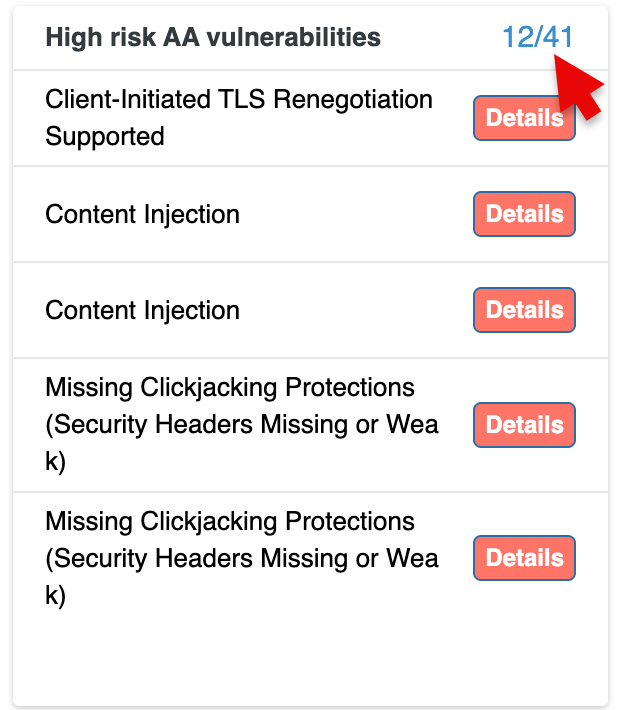
This section highlights the most critical vulnerabilities detected within your environment.
- Each vulnerability is listed with a brief description (e.g., "Client-Initiated TLS Renegotiation Supported", "Content Injection").
- For each vulnerability, there is a "Details" button that you can click to view more in-depth information about the issue and suggested fixes.
Clicking on the vulnerability count opens the complete details of the vulnerabilities in web application and takes you to the Web APP tab in Vulnerabilities.
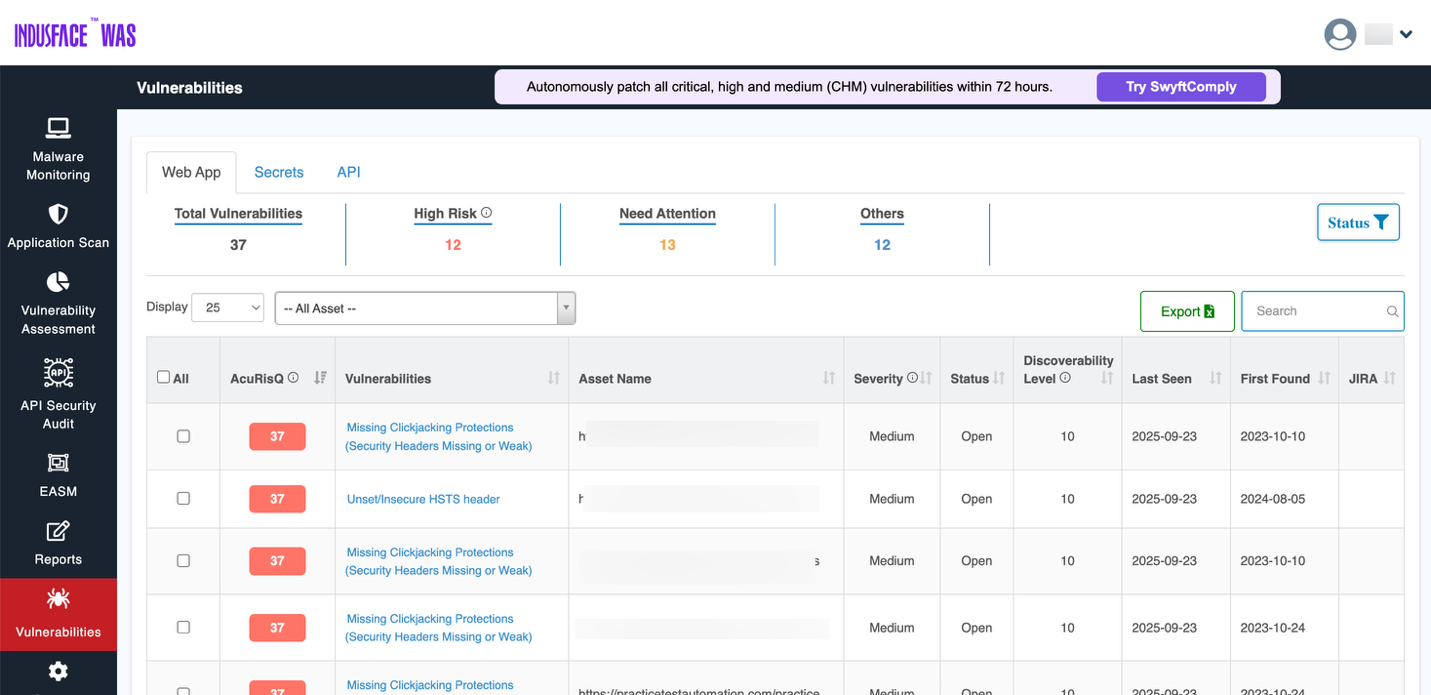
To explore web application vulnerabilities, evidence, and remediation workflows in detail, see the Vulnerabilities -> Web App Documentation.
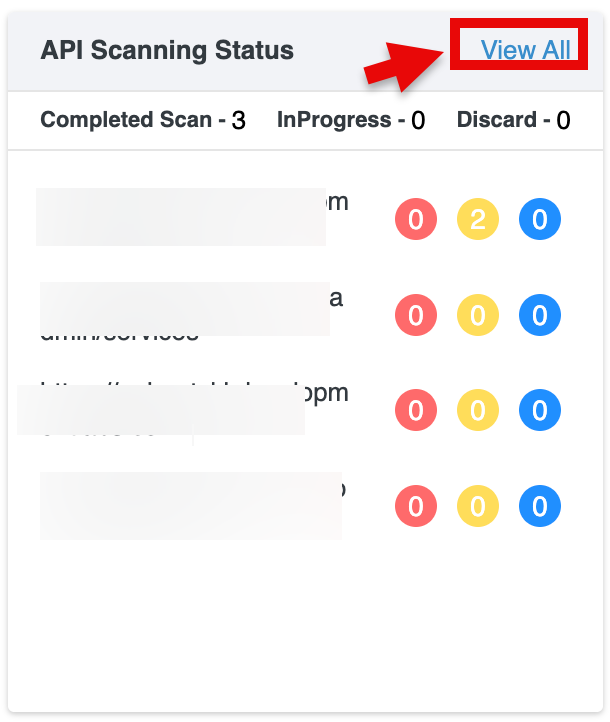
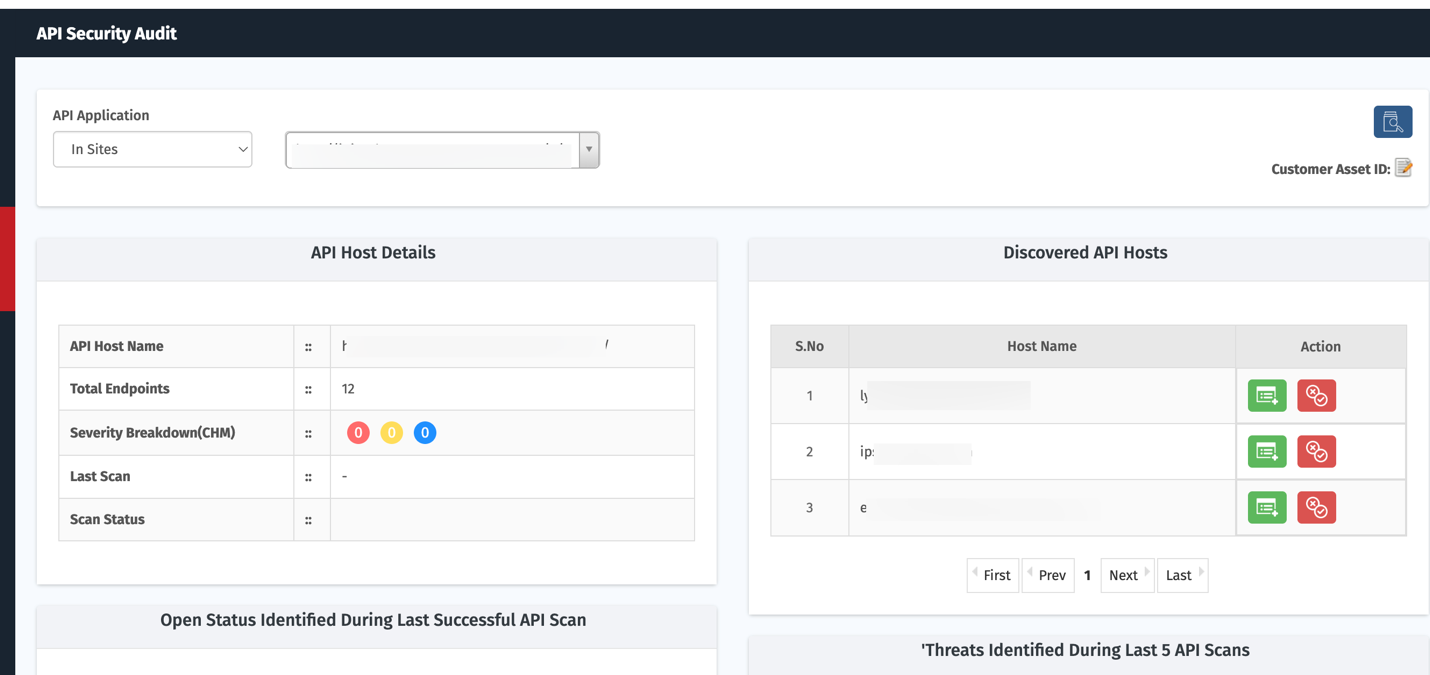
API Scanning Status
This section tracks the scanning progress of your API endpoints.
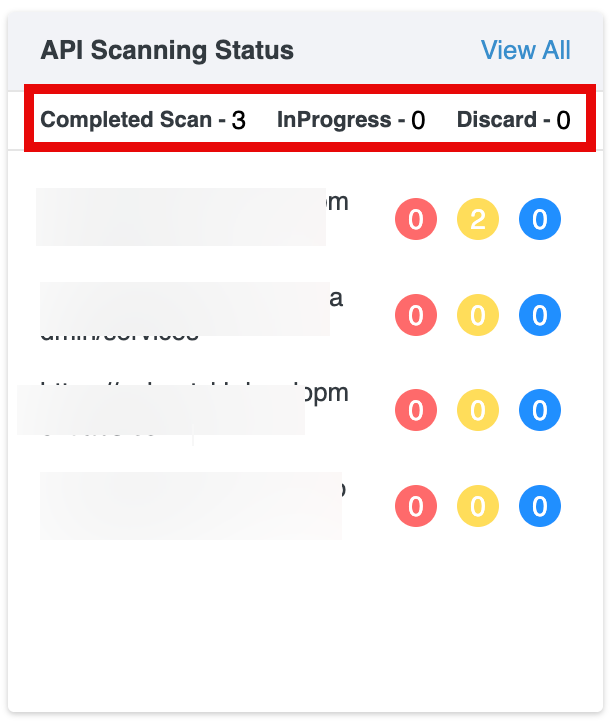
Scan Summary: Displays the number of API scans in each state: Completed Scans, In Progress, or Discard .
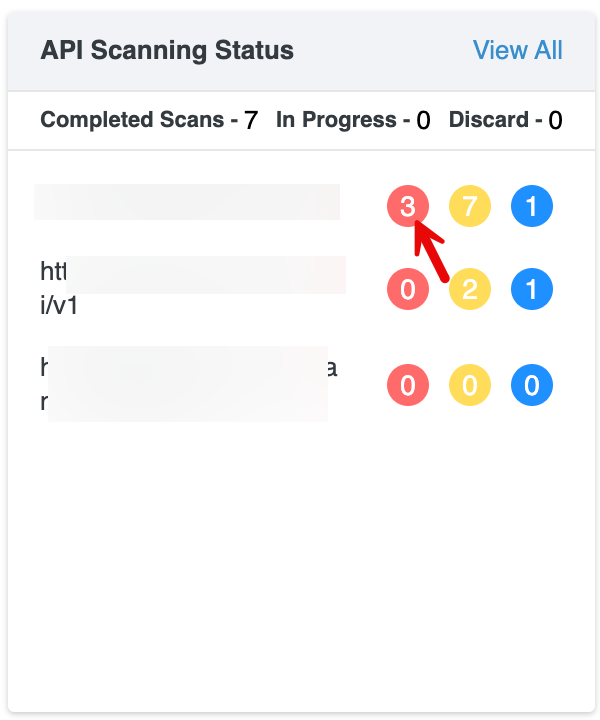
API Findings: Each API host is listed with colored counters representing findings by severity:
- Red: Critical
- Yellow: High
- Blue: Medium
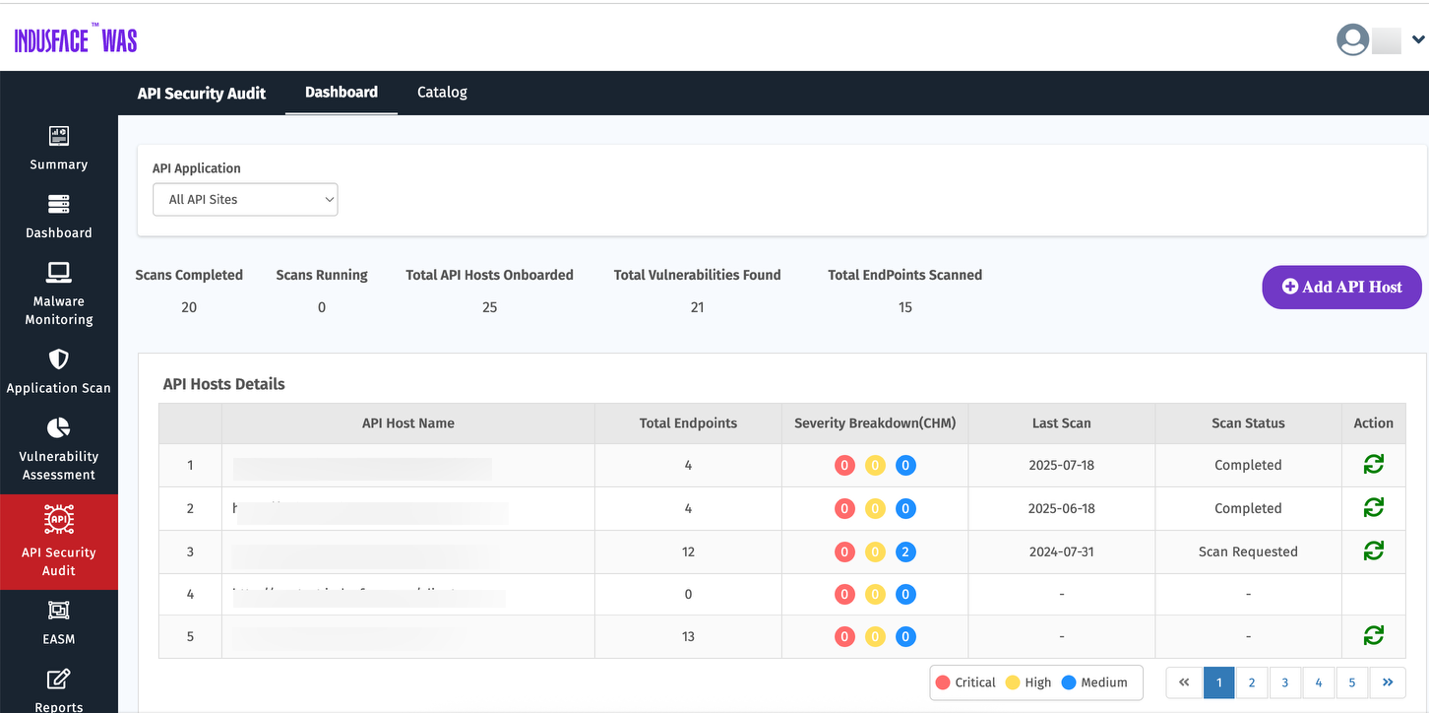
View All: Selecting View All opens the complete list of API scans and navigates to the API Security page for detailed information.
Clicking any severity badge (Critical, High, or Medium) redirects you to the API vulnerabilities page.
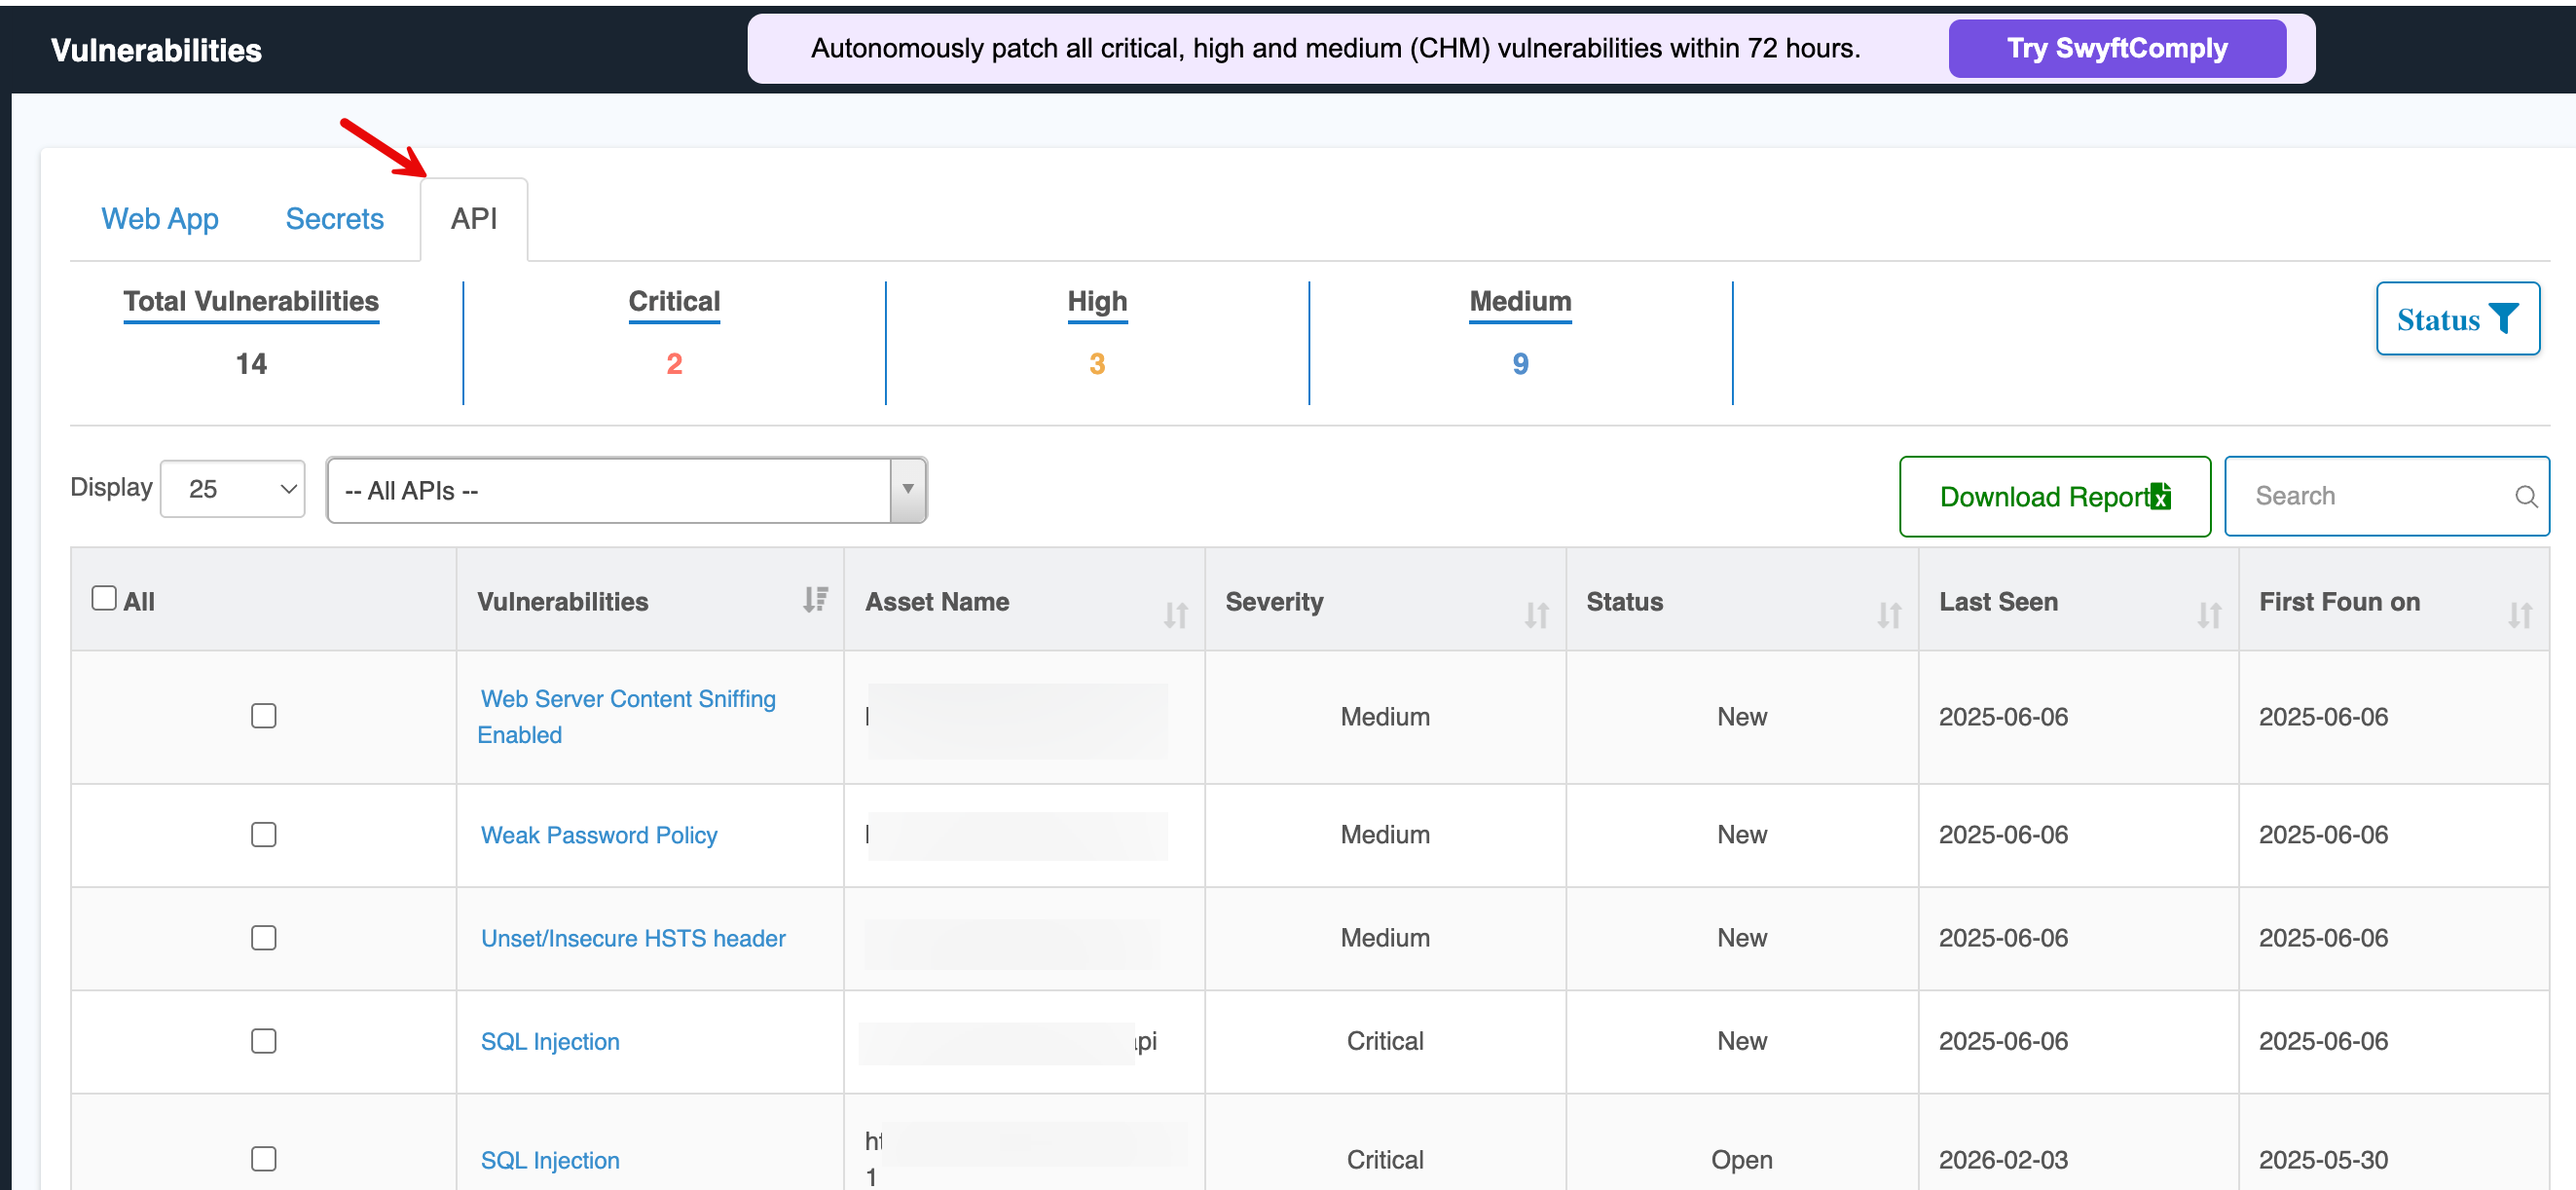
For comprehensive details on API security monitoring, evidence, and remediation workflows, refer to the API Documentation.
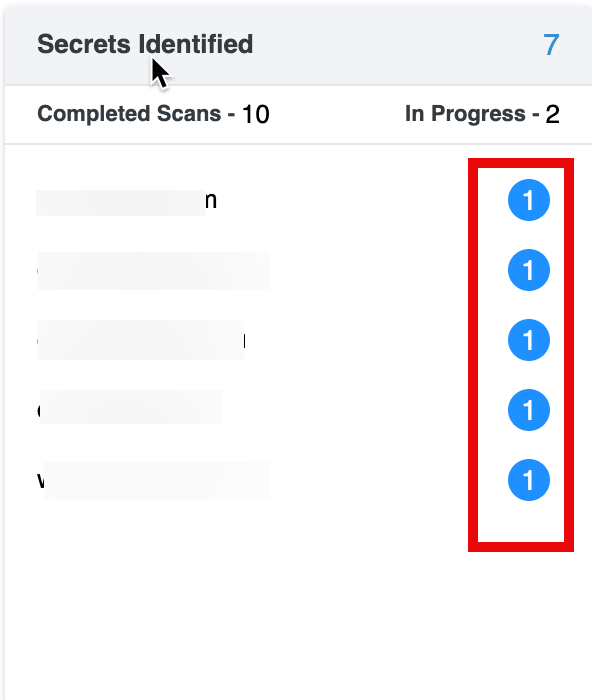
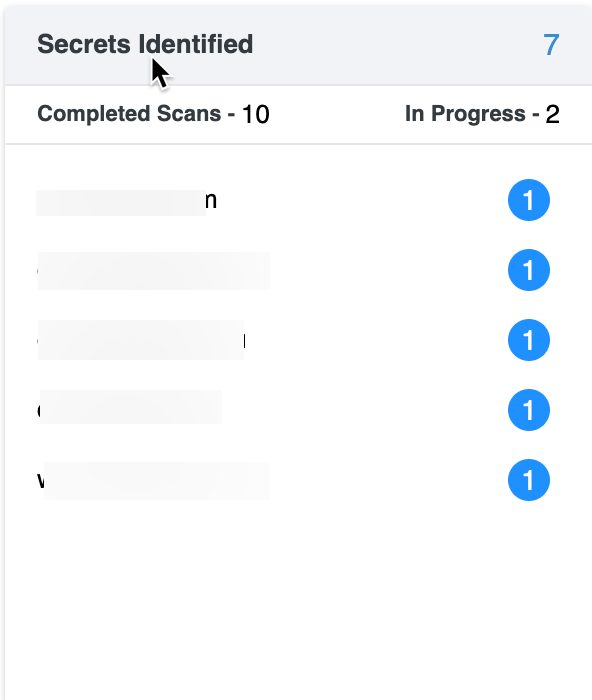
Secrets Identified
This section provides a detailed overview of identified secrets (e.g., API keys, passwords, or tokens exposed in your environment).

Scan Summary: Displays the number of scans in each state: Completed or In Progress.
Each identified secret is linked to a URL, showing where the potential secret was detected. These links serve as a starting point to address and secure the exposed secrets.
Secrets Overview in EASM
By clicking the total identified secrets, you can view the complete details of the assets and navigate to the Secrets tab in EASM.

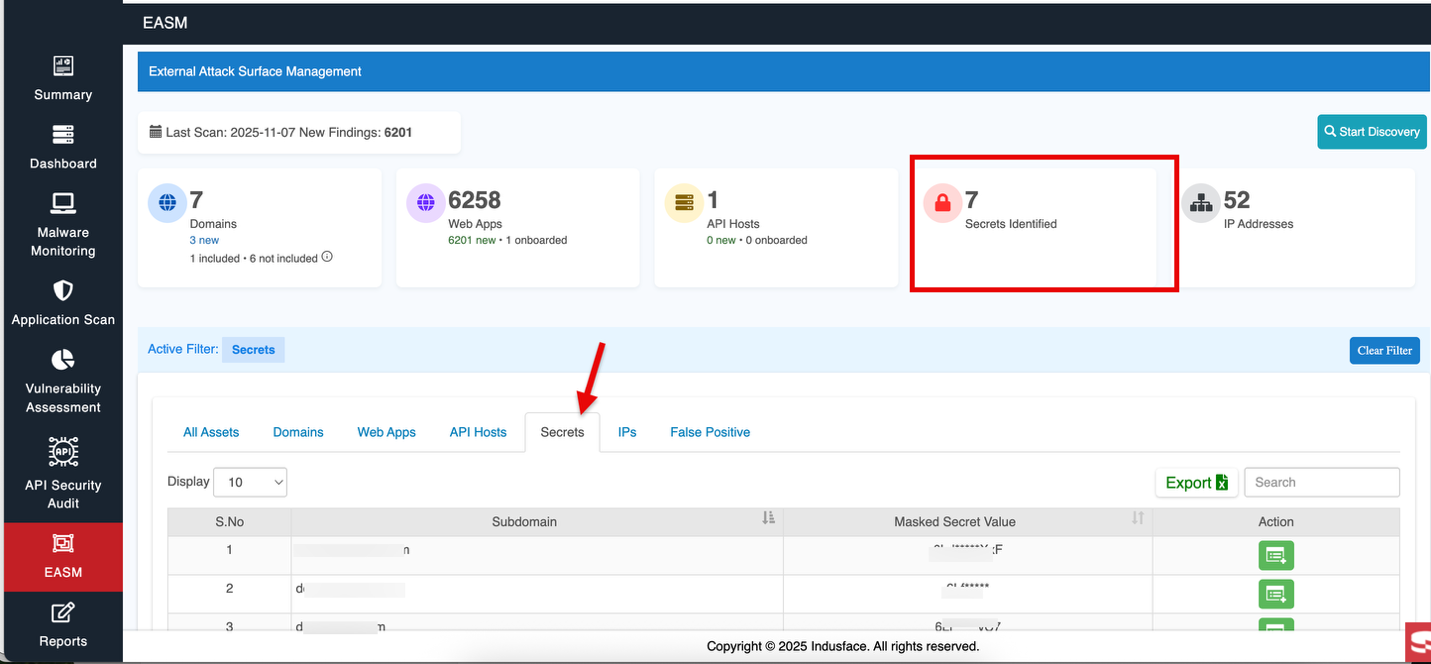
For comprehensive information about complete external attack surface management and identified secrets, refer to the EASM - > Secrets Documentation.
Secrets Overview in Vulnerabilities
By clicking Secrets, you can view the complete details and navigate to the Secrets tab in Vulnerabilities.
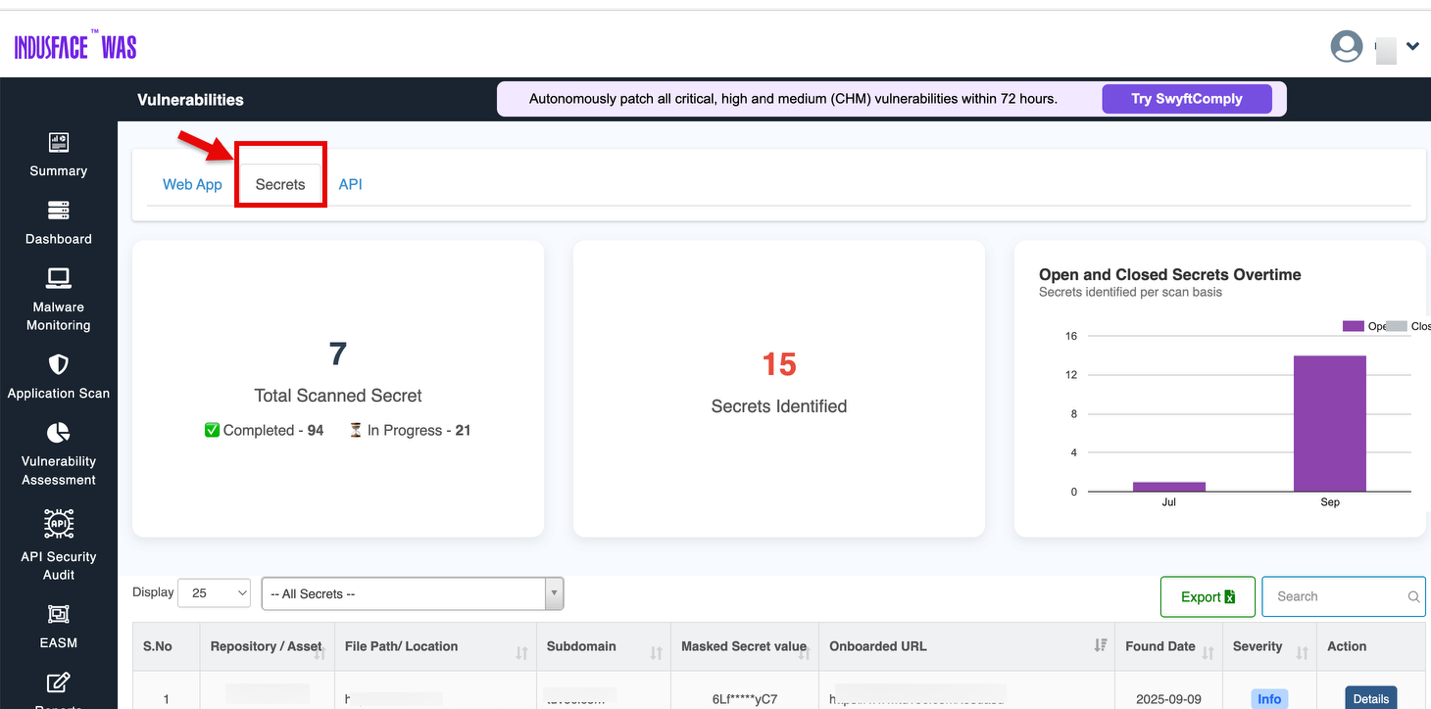
For comprehensive information about identified secrets, their severity and action taken, refer to the Vulnerbailities - > Secrets Documentation .
Executive Report
Generates a high-level report summarizing security findings, intended for executives and decision-makers who need an overview of the system's security status without deep technical details.
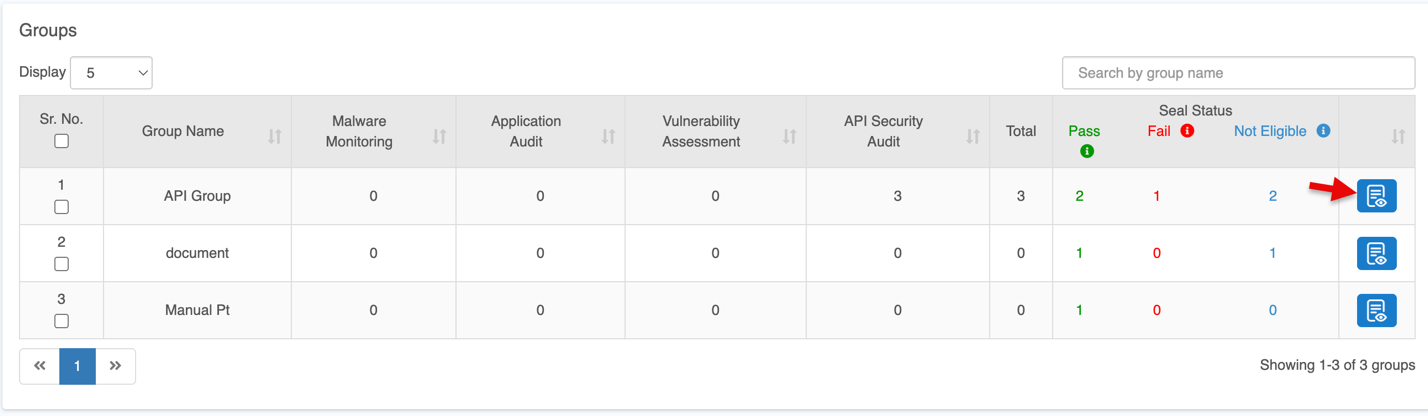
Group(s)
The Groups section allows you to manage and track multiple groups, their associated scan services, vulnerability counts, and scan status.
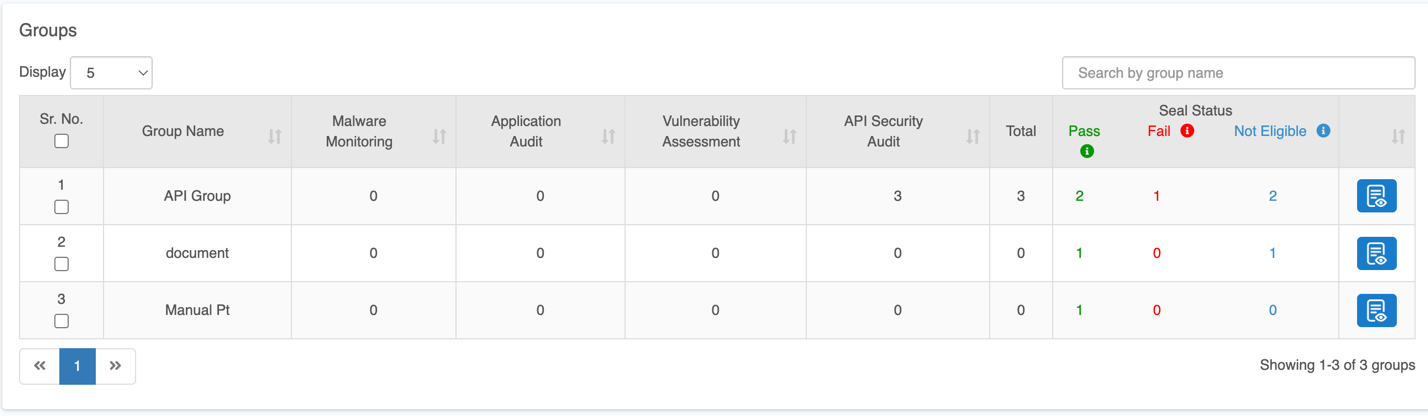
Select Groups: Click the Groups option to choose one or multiple groups. All websites associated with the selected groups will be listed under the Sites section.
Click Settings and then Groups to create a new group.
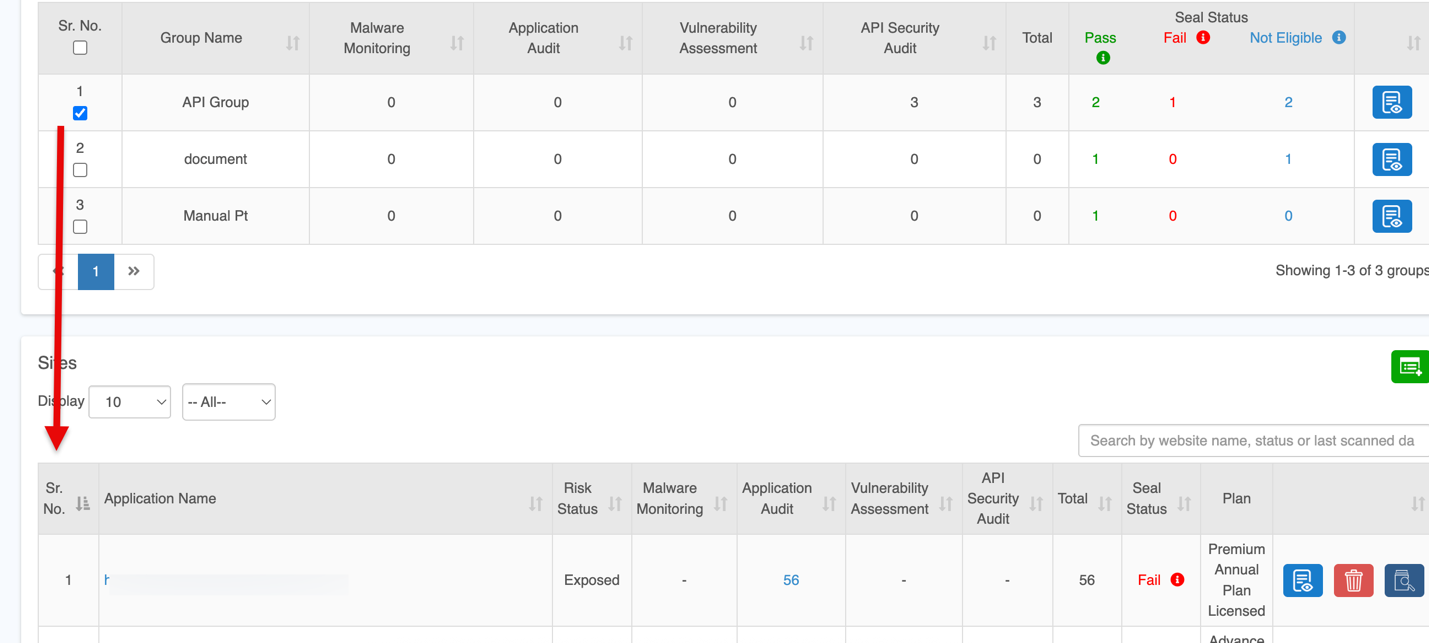
When multiple groups are selected, the Sites list will show the unique set of websites across all selected groups.
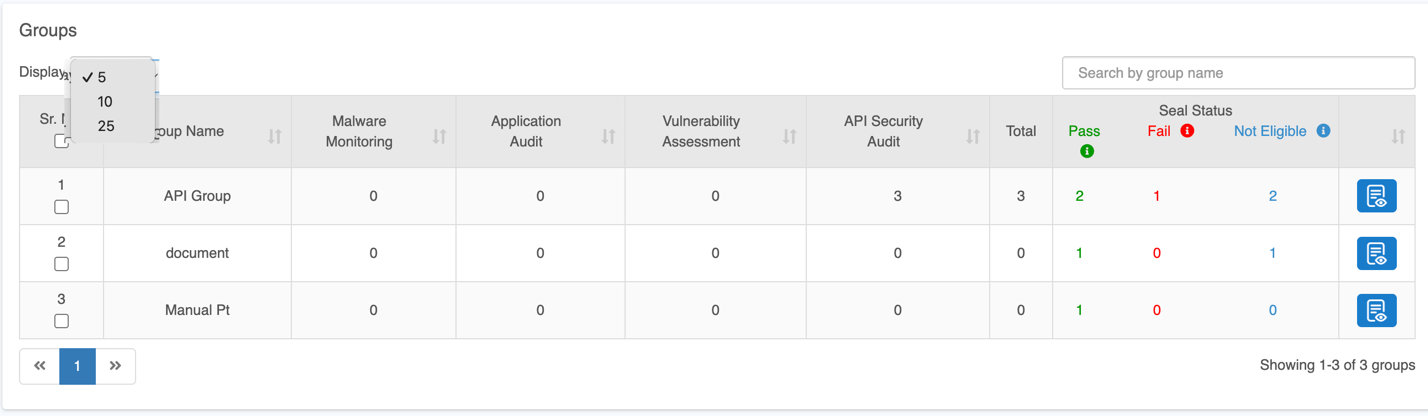
Use the Display dropdown to choose how many records you want to view on the screen.
Click the View Details icon to view the complete security status of the selected group.
This action takes you to the Dashboard screen, which provides detailed insights such as:
- Threats detected in the most recent scans
- Top recurring or high-frequency threats
- Additional security metrics presented in graphical format
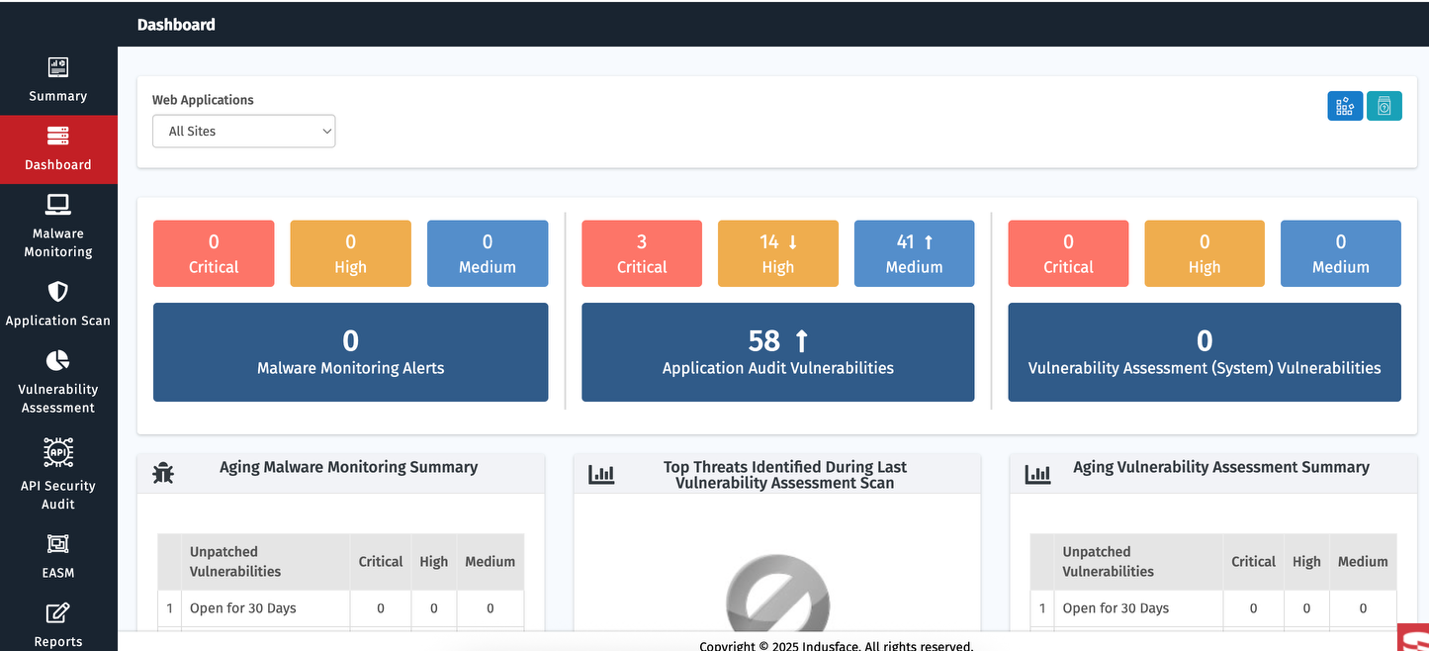
To understand all dashboard features and visual metrics in detail, see the Dashboard Documentation.
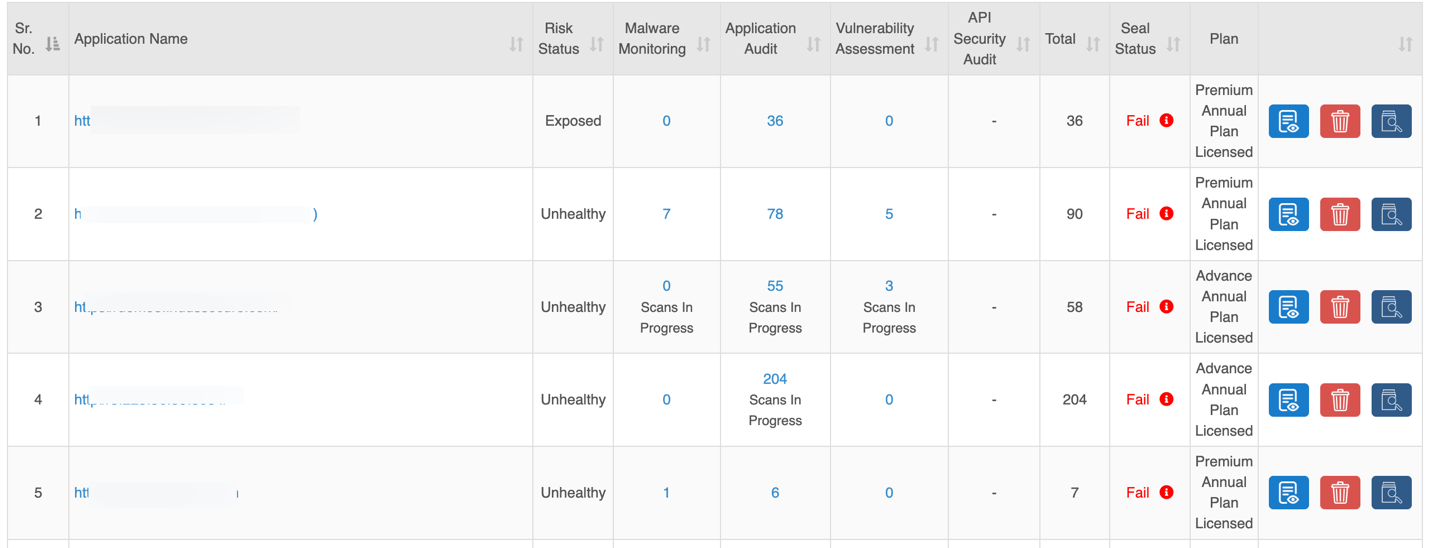
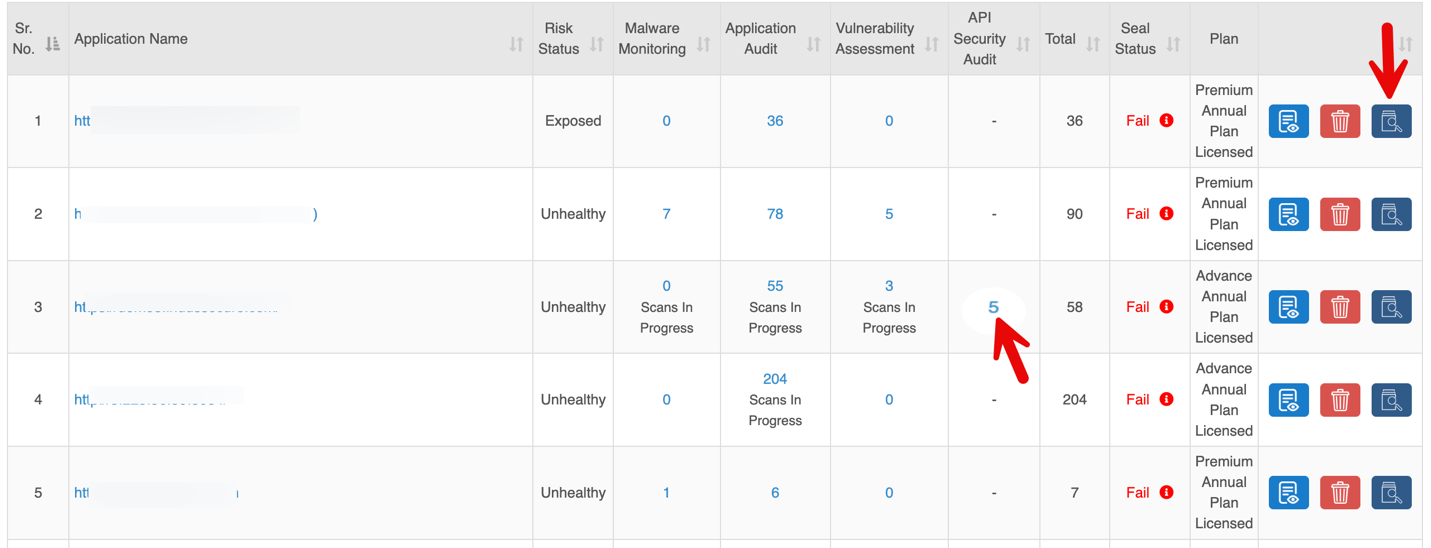
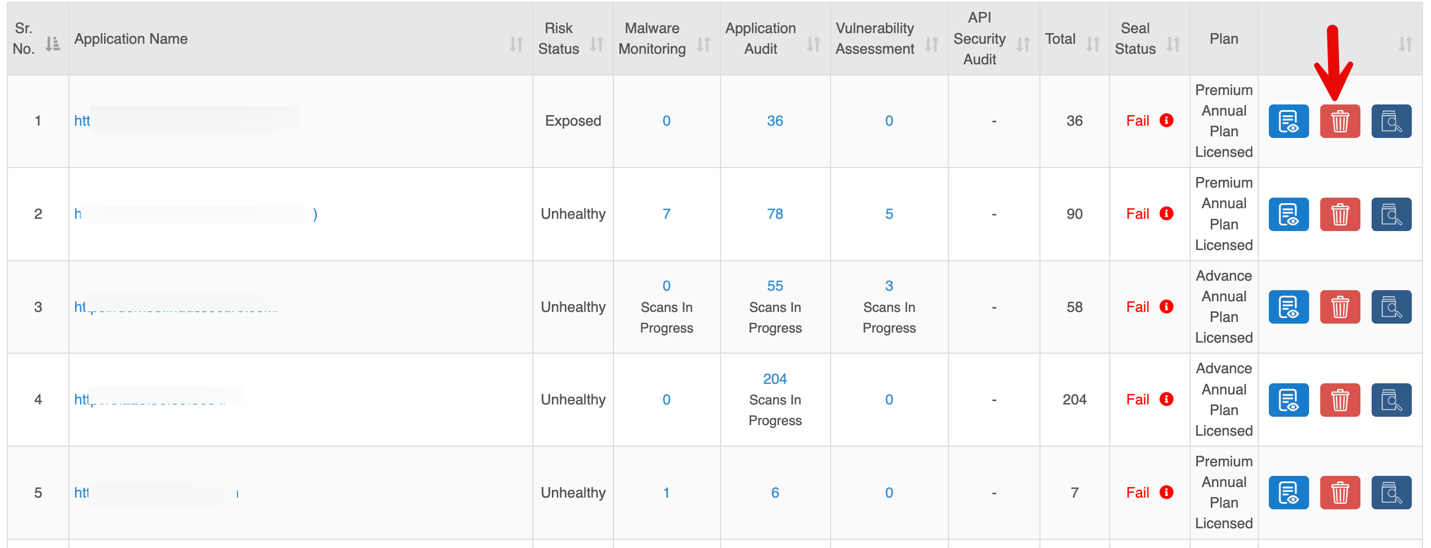
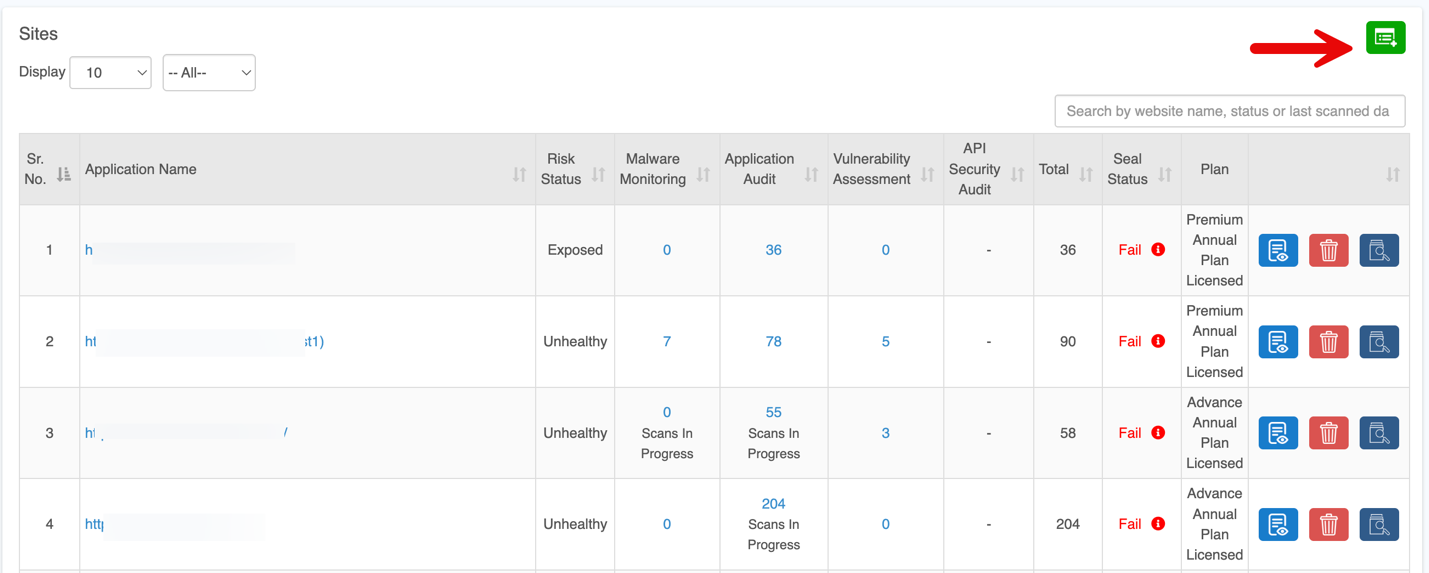
Sites
The Sites section provides a centralized view of all applications and APIs, showing security status, audit results, and subscription plans with quick actions like view, delete, or scan.
| Column | Description |
| Application Name | URL of the onboarded application or API. |
| Risk Status | Indicates the overall security status of each application. |
| Malware Monitoring | Number of findings from Malware Monitoring scans |
| Application Audit | Number of findings from Authentication Audit scans. |
| Vulnerability Assessment | Number of findings from Vulnerability Assessment. |
| API Security Audit | Number of findings from API scans. |
| Total | Combined count of findings from all scans. |
| Seal Status | Security scan result: Not Eligible: All services not subscribed or scans incomplete. Fail: Critical or High-severity vulnerabilities detected; remediation required. Pass: All services cleared with no Critical or High vulnerabilities.
|
| Plan | Subscription plan assigned to the site. |
| Quick Controls | Options to View Details, Delete, Scan Now. |
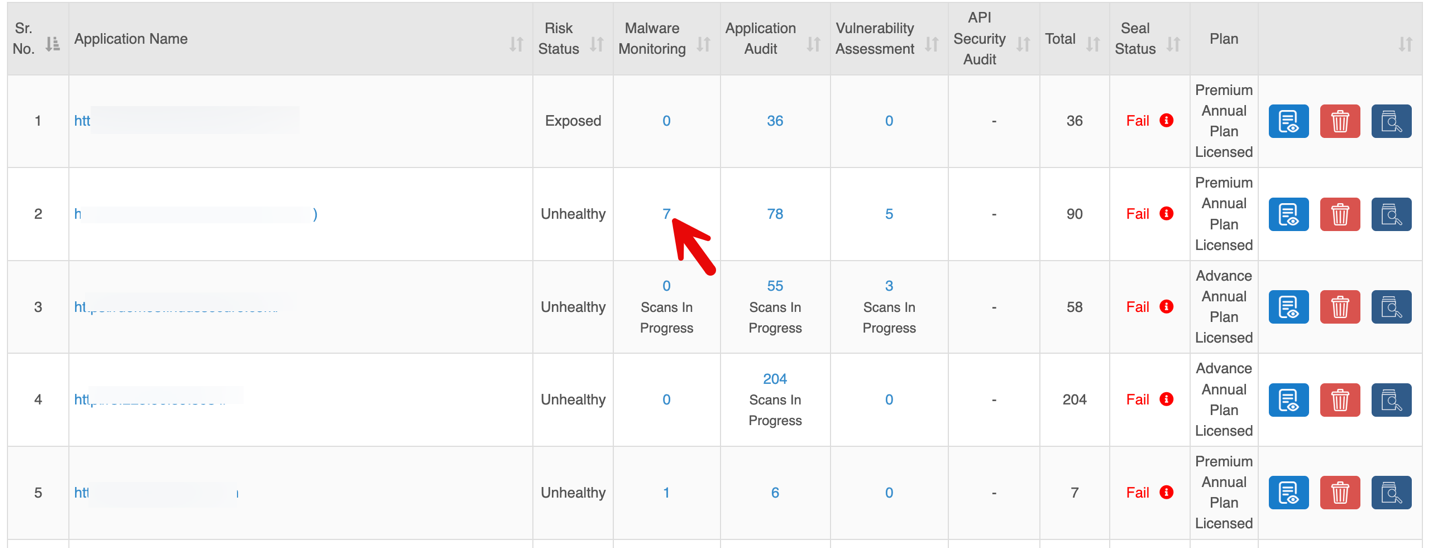
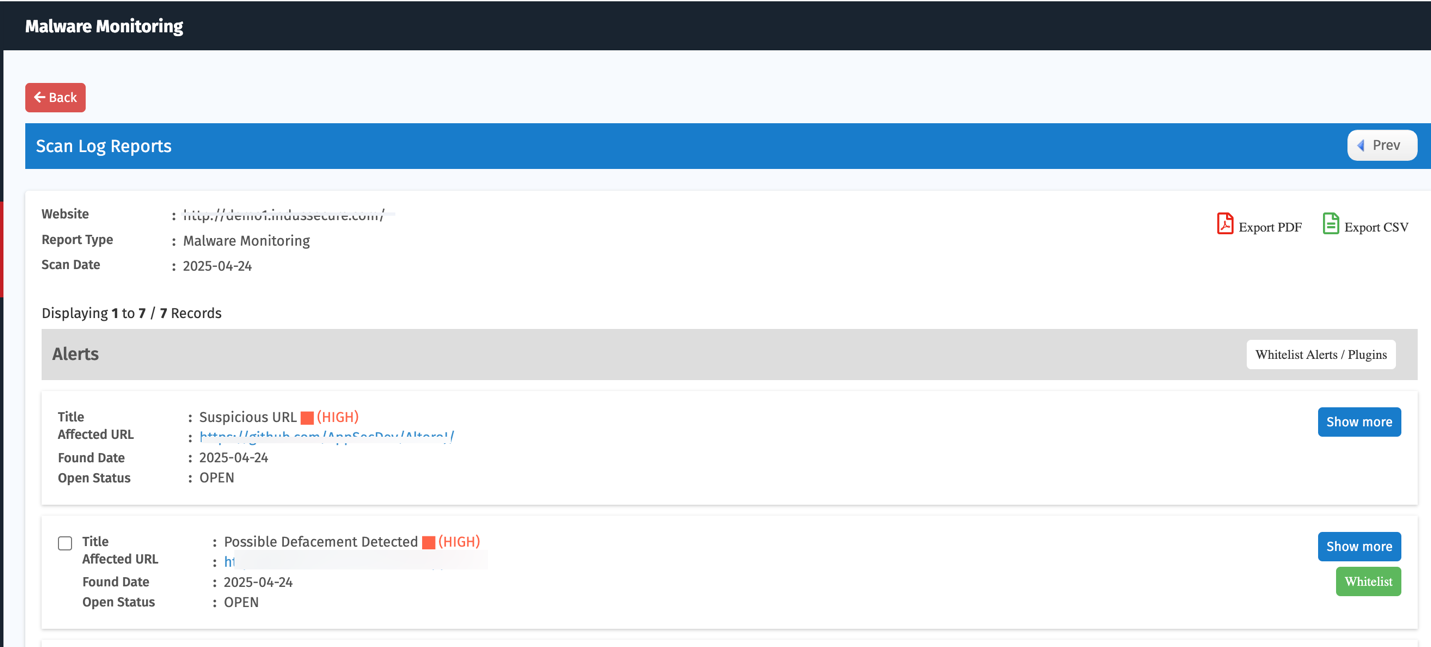
Detailed Report: Malware Monitoring
Click the total count in the Malware Monitoring column for a specific application to view detailed findings.
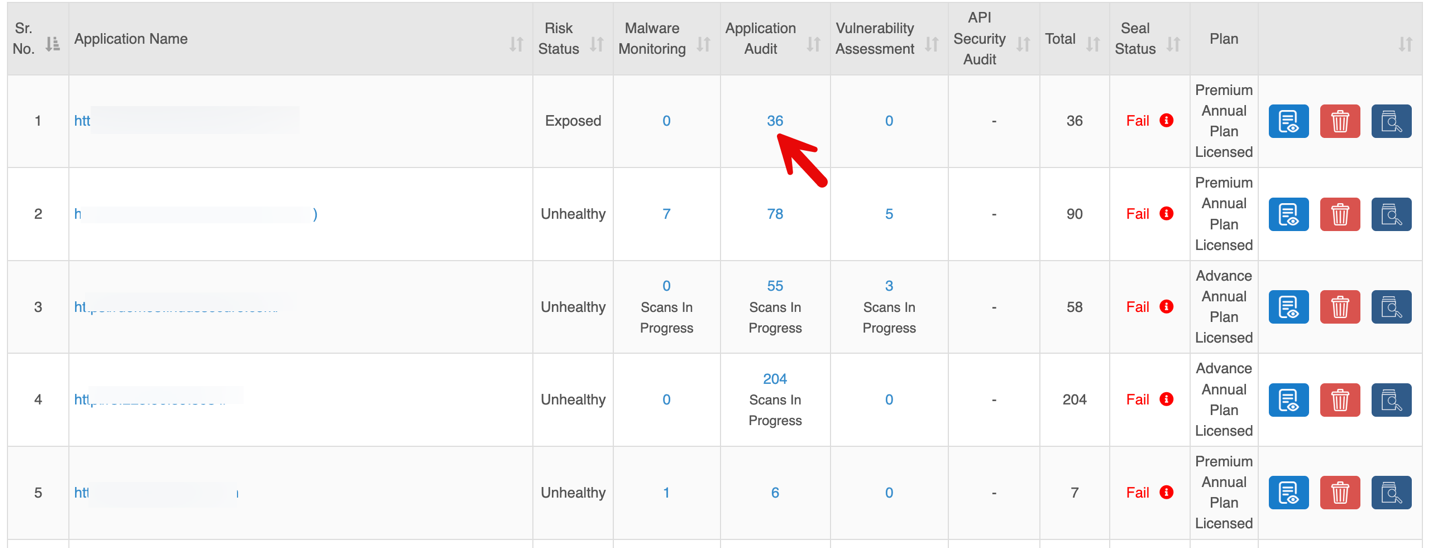
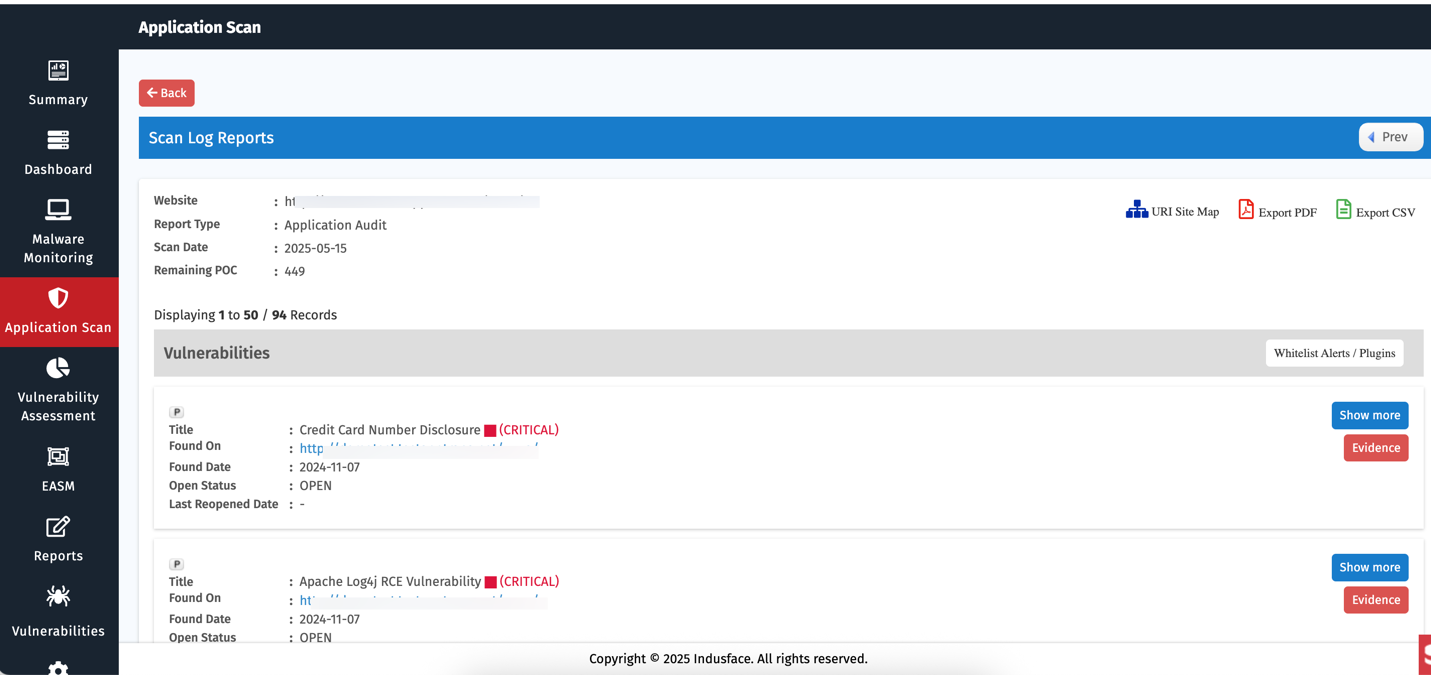
Detailed Report: Application Audit
Click the total count in the Application Audit column for a specific application to view detailed findings.
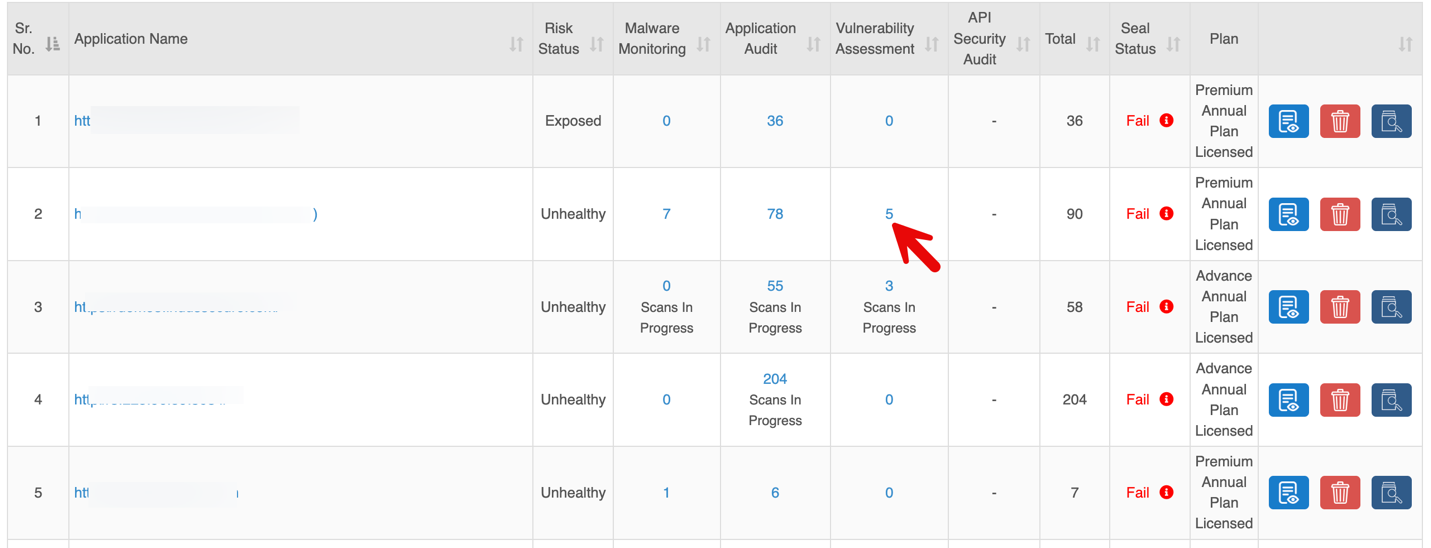
Detailed Report: Vulnerability Assessment
Click the total count in the Vulnerability Assessment column for a specific application to view detailed findings.
Detailed Report: API Security Audit
Click the total count in the API Security Audit column for a specific application to view detailed findings.
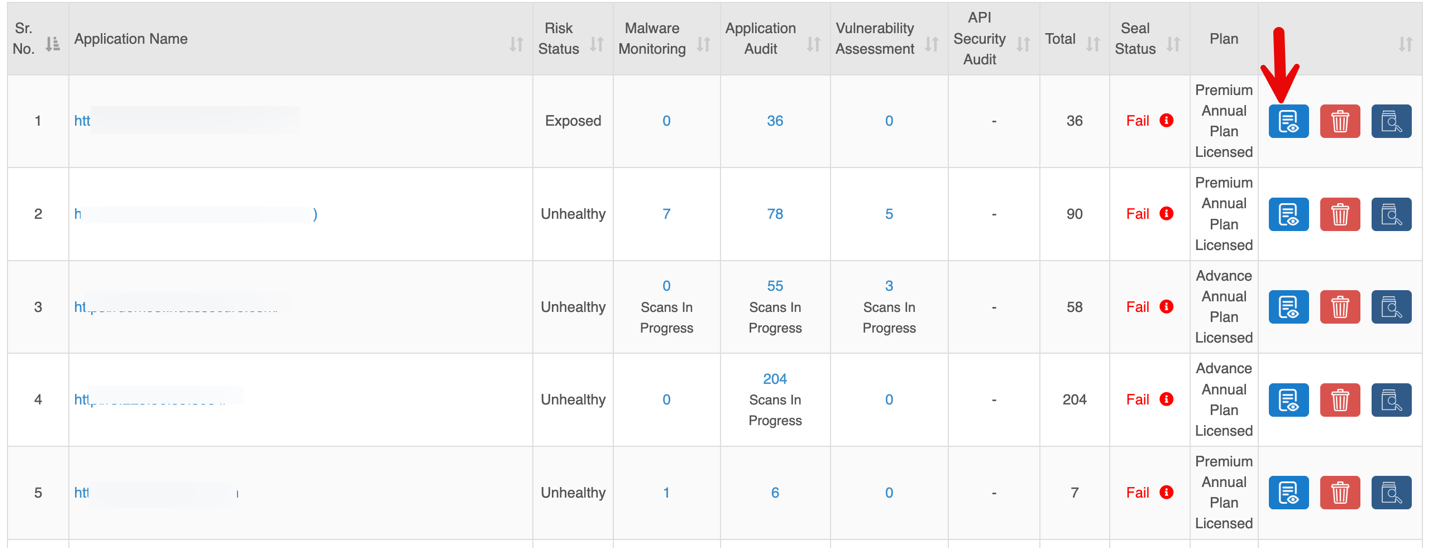
Quick Actions
1. View Details
Clicking the View Details button redirects to the Dashboard Tab, displaying a detailed overview of the selected site.

2. Delete
Clicking the Delete button opens a Survey Form to capture the reason for deletion and confirm the action.
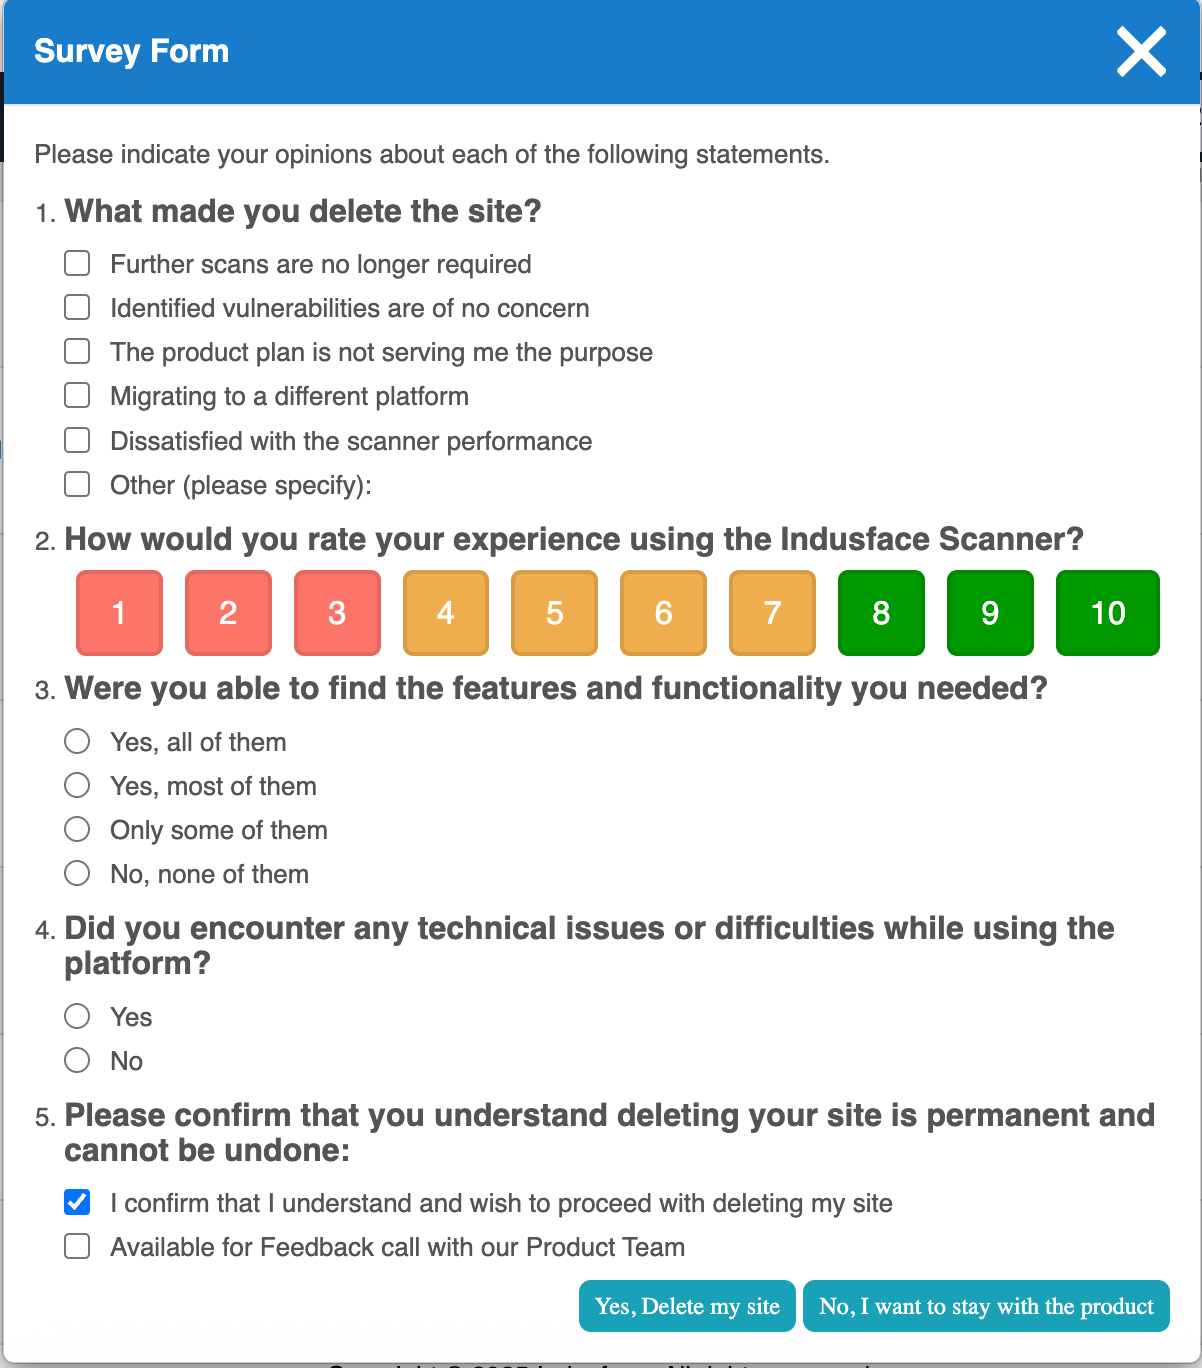
Clicking Yes, Delete my site permanently removes the URL, and a confirmation message is displayed once the deletion is successful.
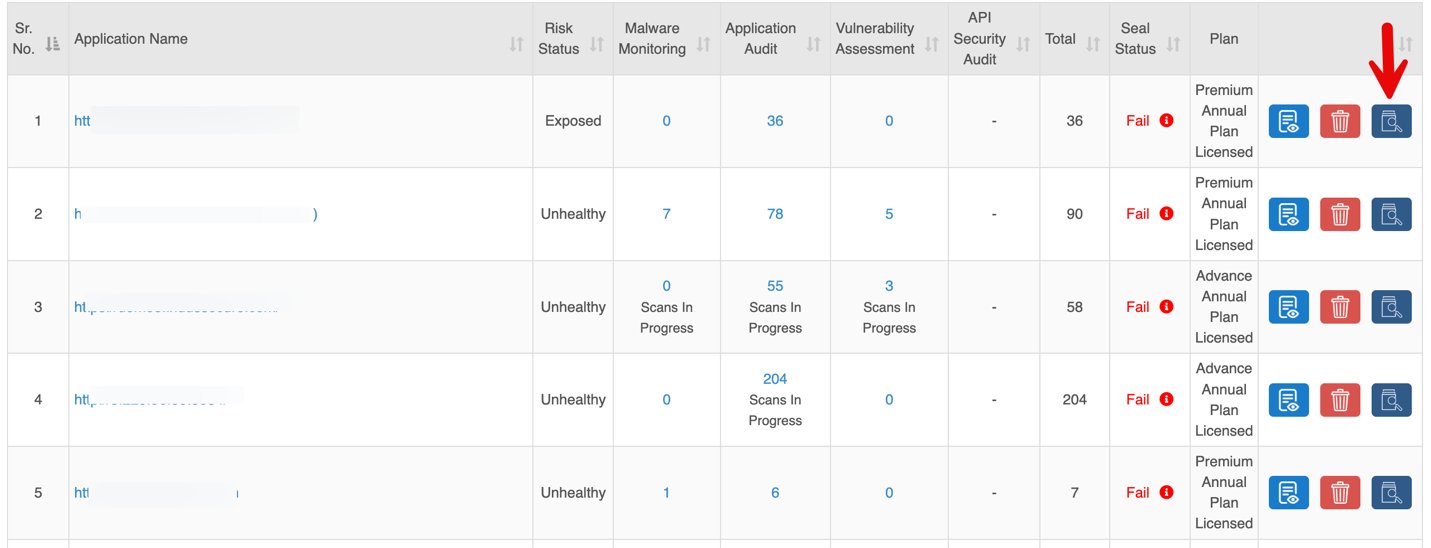
3. Start Scan
Clicking the Scan Now button opens the Start Scan popup.
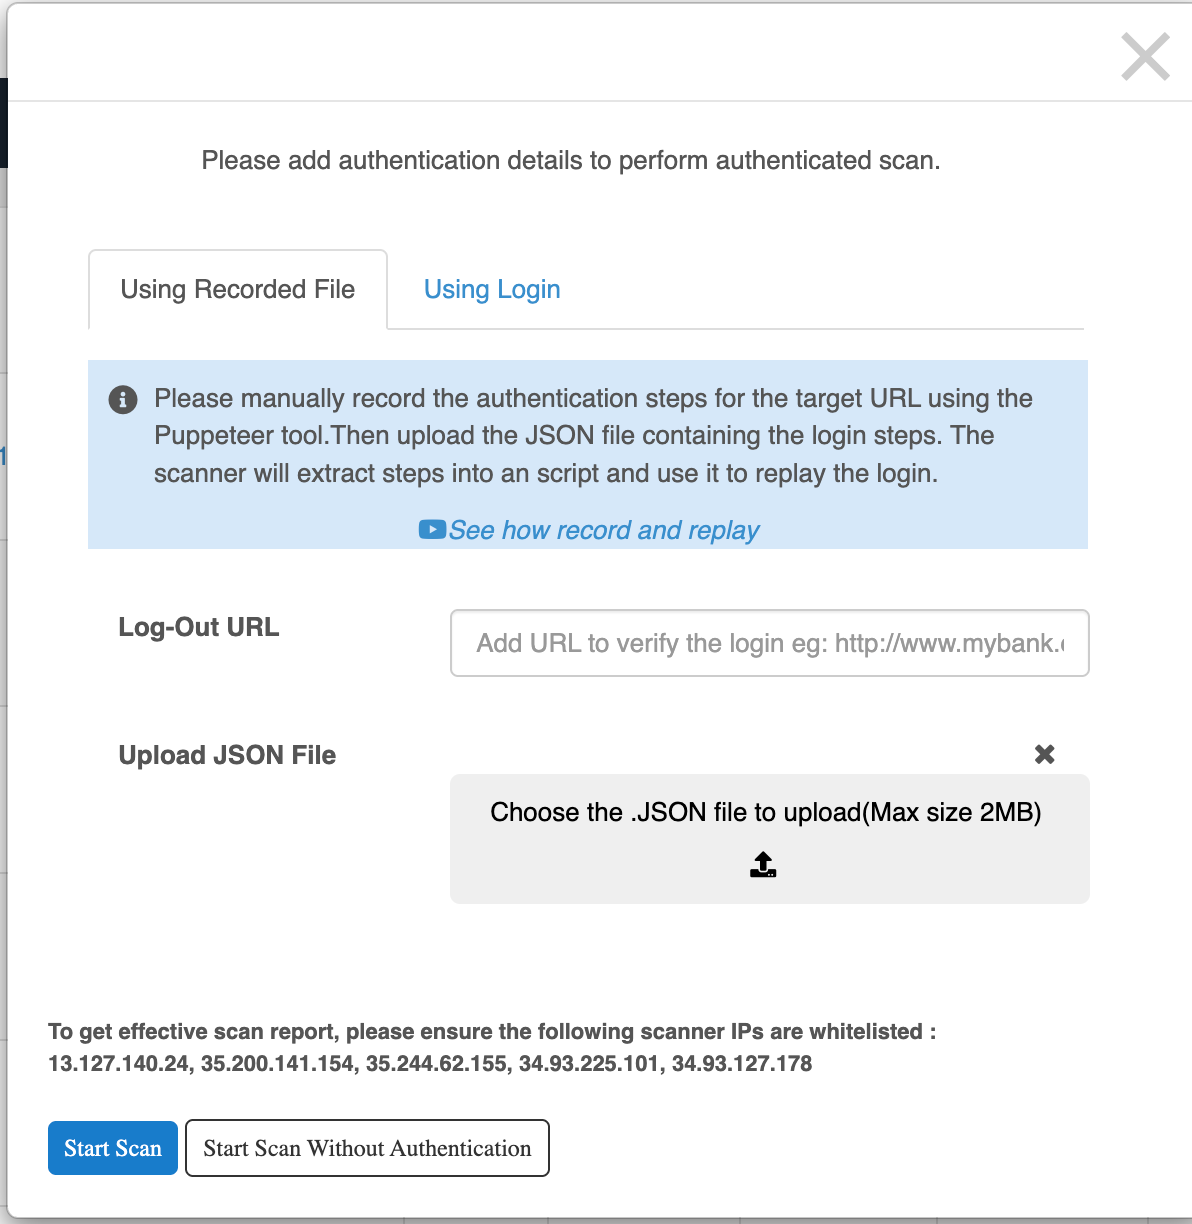
Two methods are available for providing authentication details:
1. Using Recorded File
- Upload a JSON file generated via Puppeteer that records login steps.
- Add a Logout URL to verify session validity.
- The scanner replays the recorded steps for authenticated scanning.
2. Using Login Credentials
- Enter Login URL, Username, and Password directly.
- Scanner will use these credentials for authentication.
Click Start Scan without Authentication to proceed without verification
Add Website
Users can onboard Applications for scanning either through self-service or with assistance from the Indusface Support Team.
Click the Add Website button to onboard a new application or API.
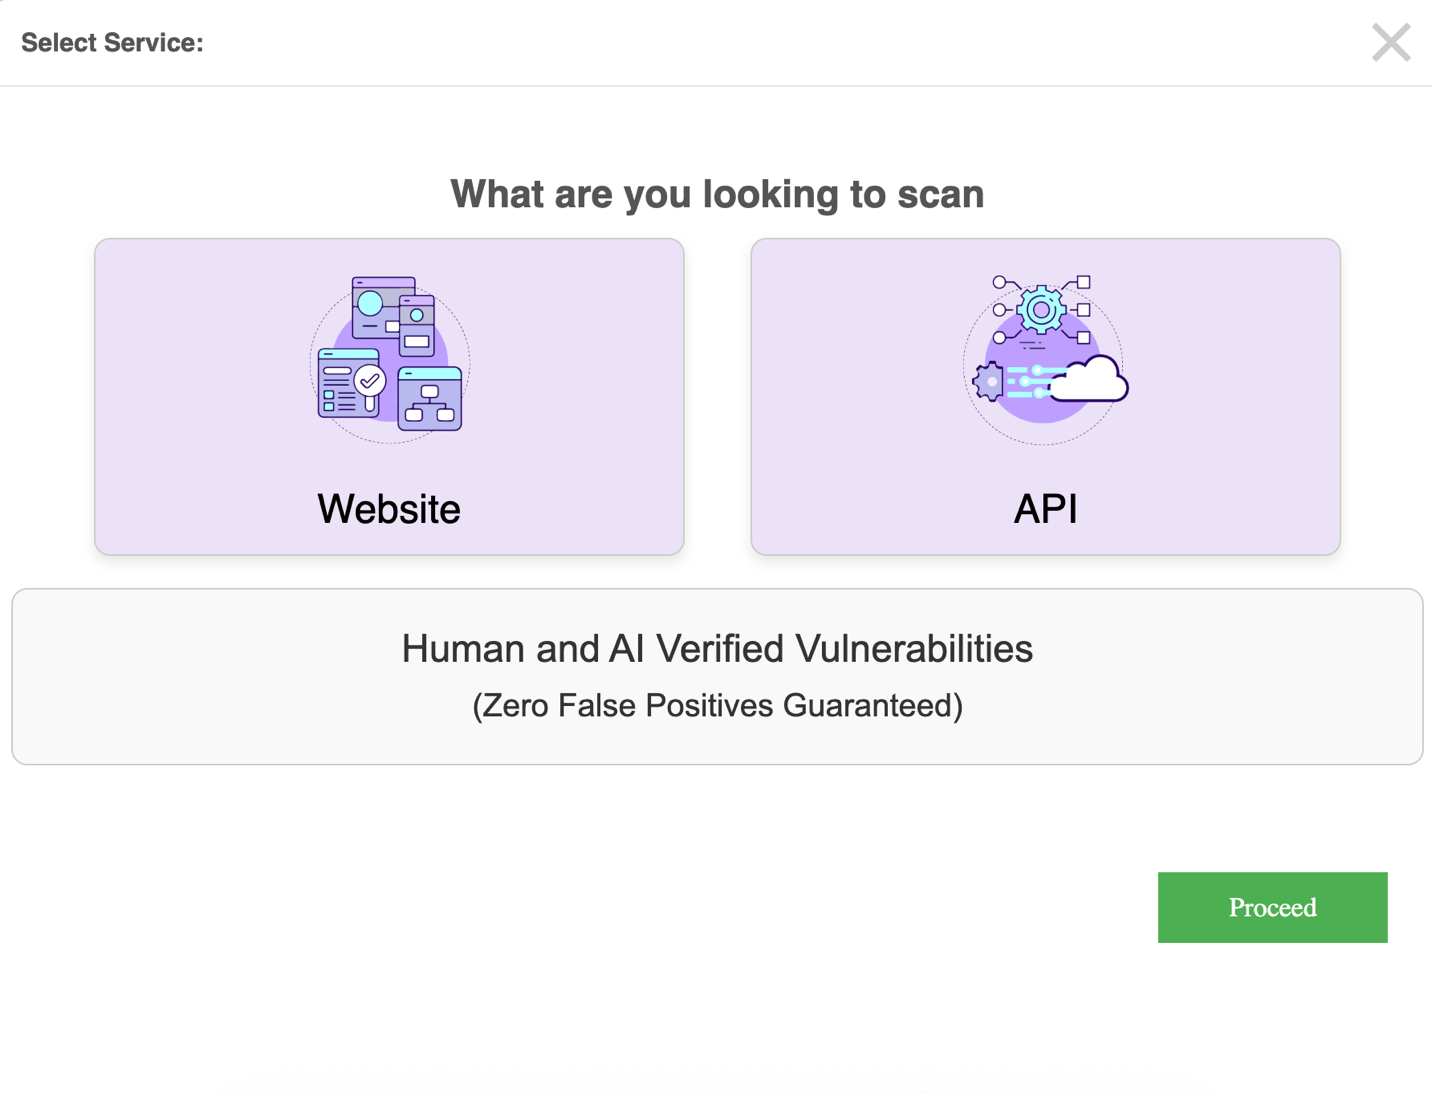
Select the Service to Proceed
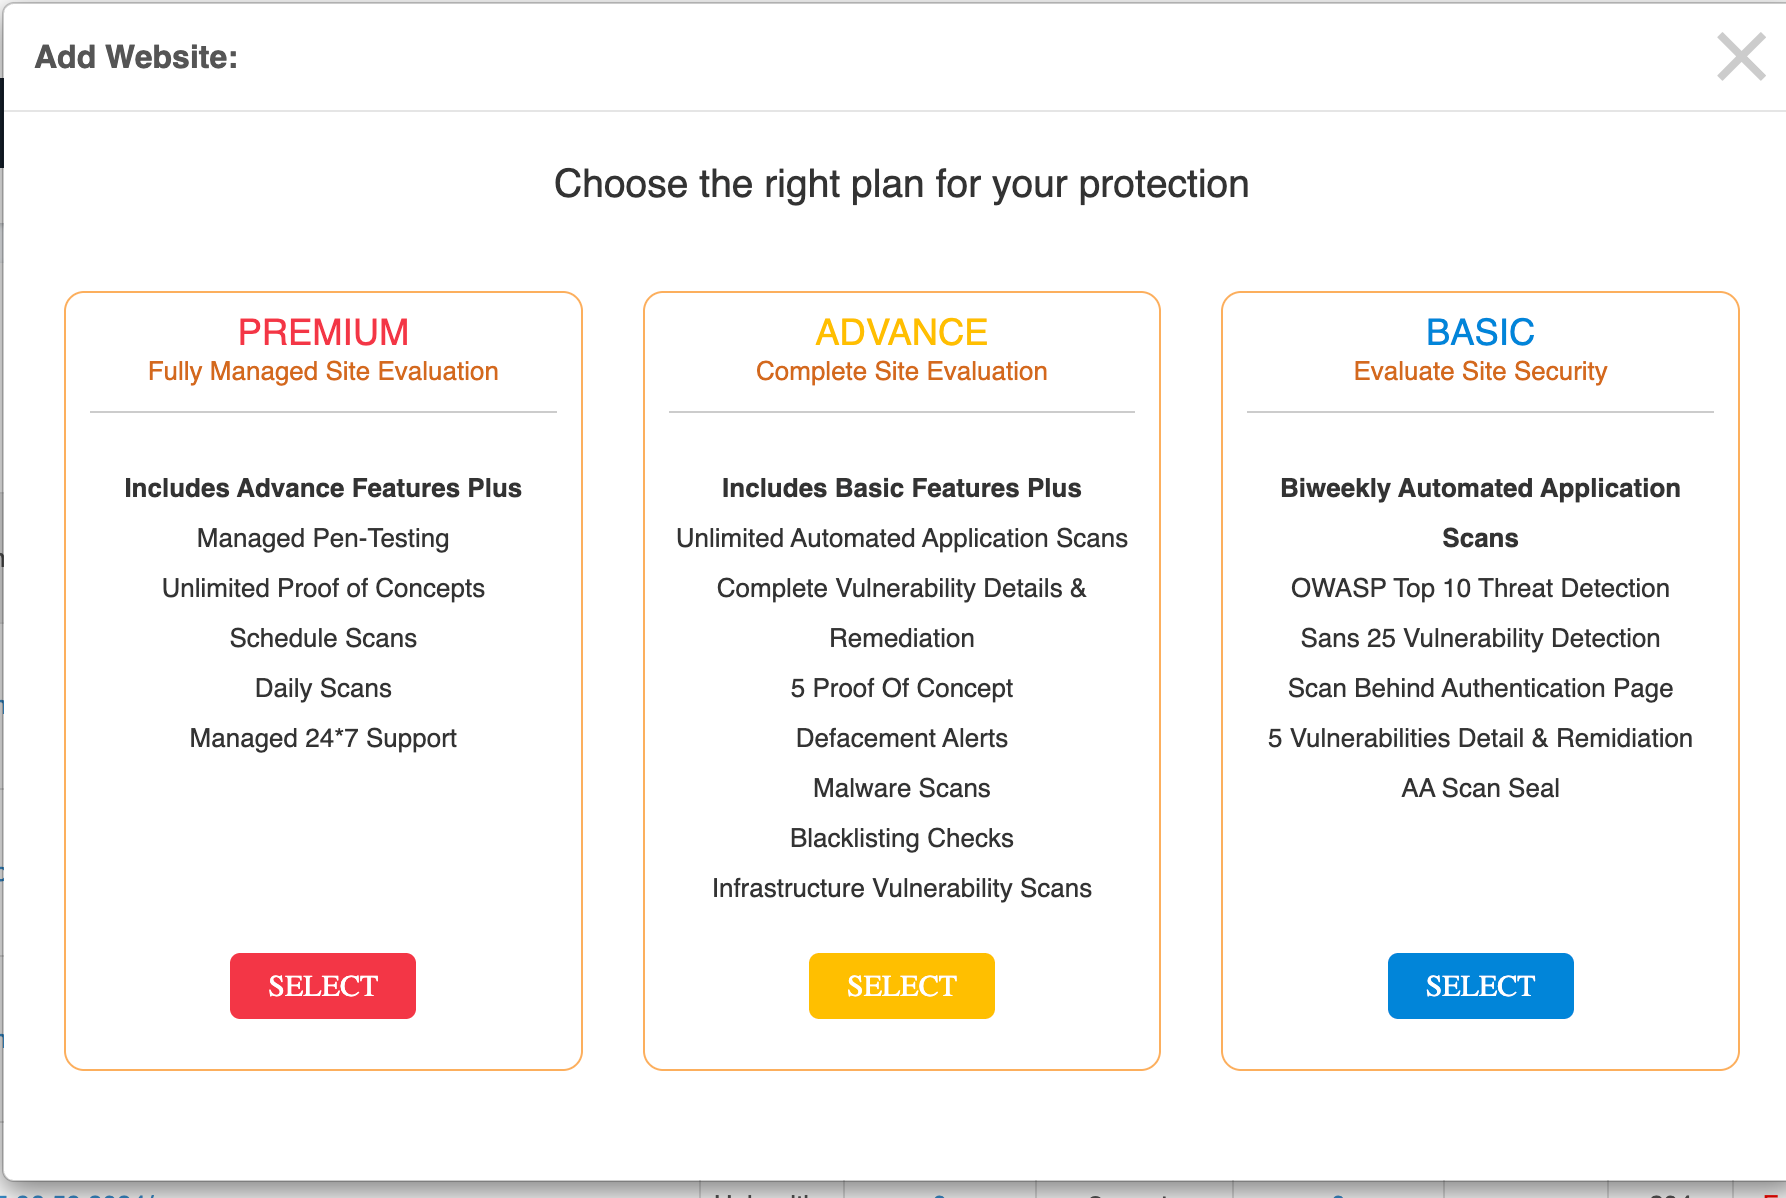
Choose your plan
Select your License
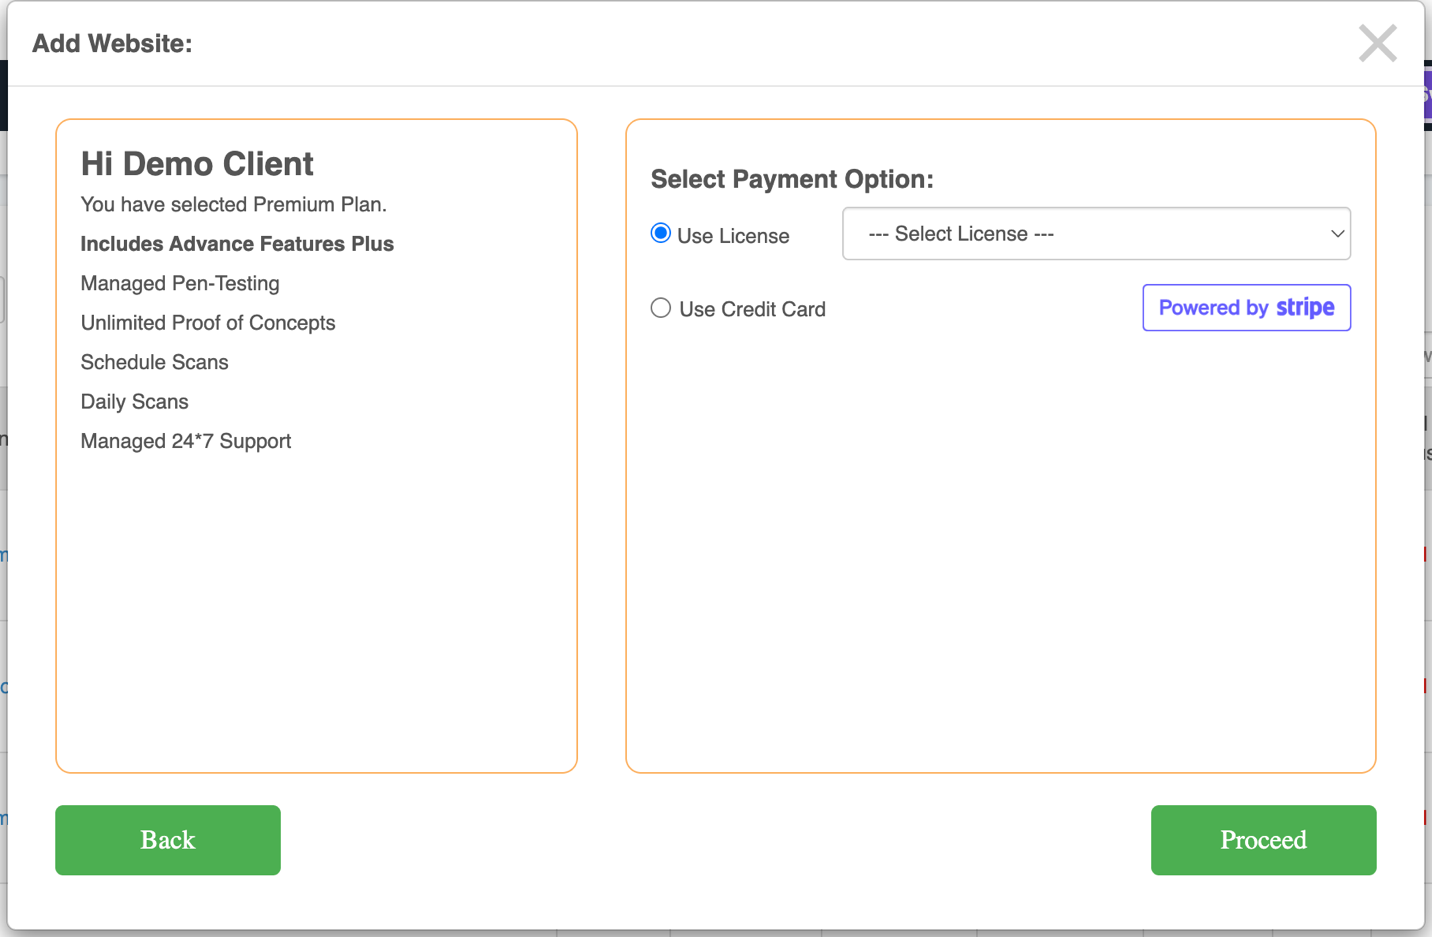
- Total licenses available
- Remaining licenses
- License expiry date
- Applicable promo codes for adding
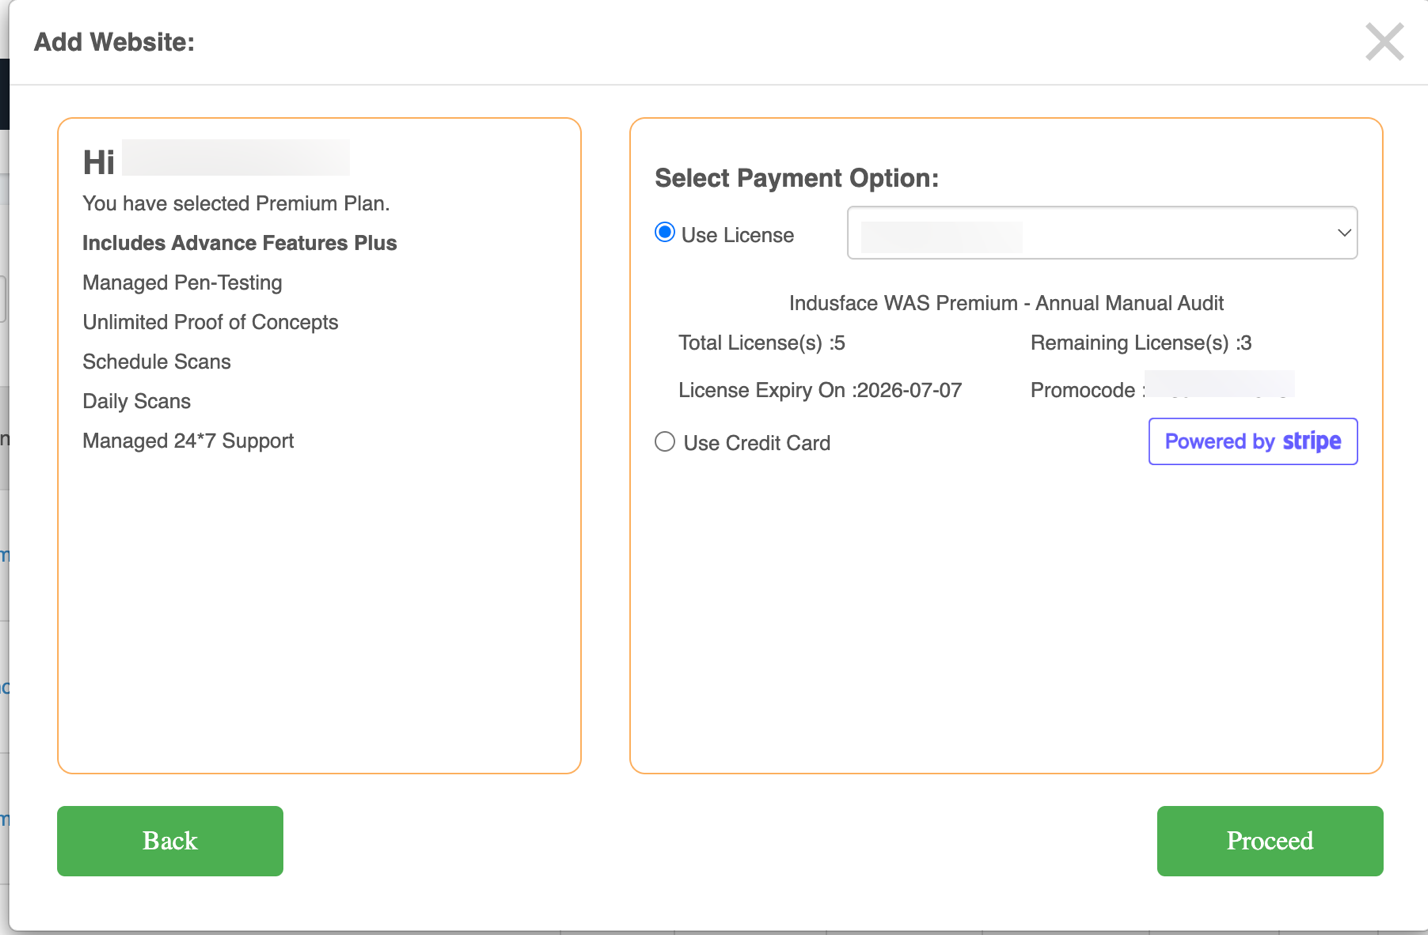
Click Proceed
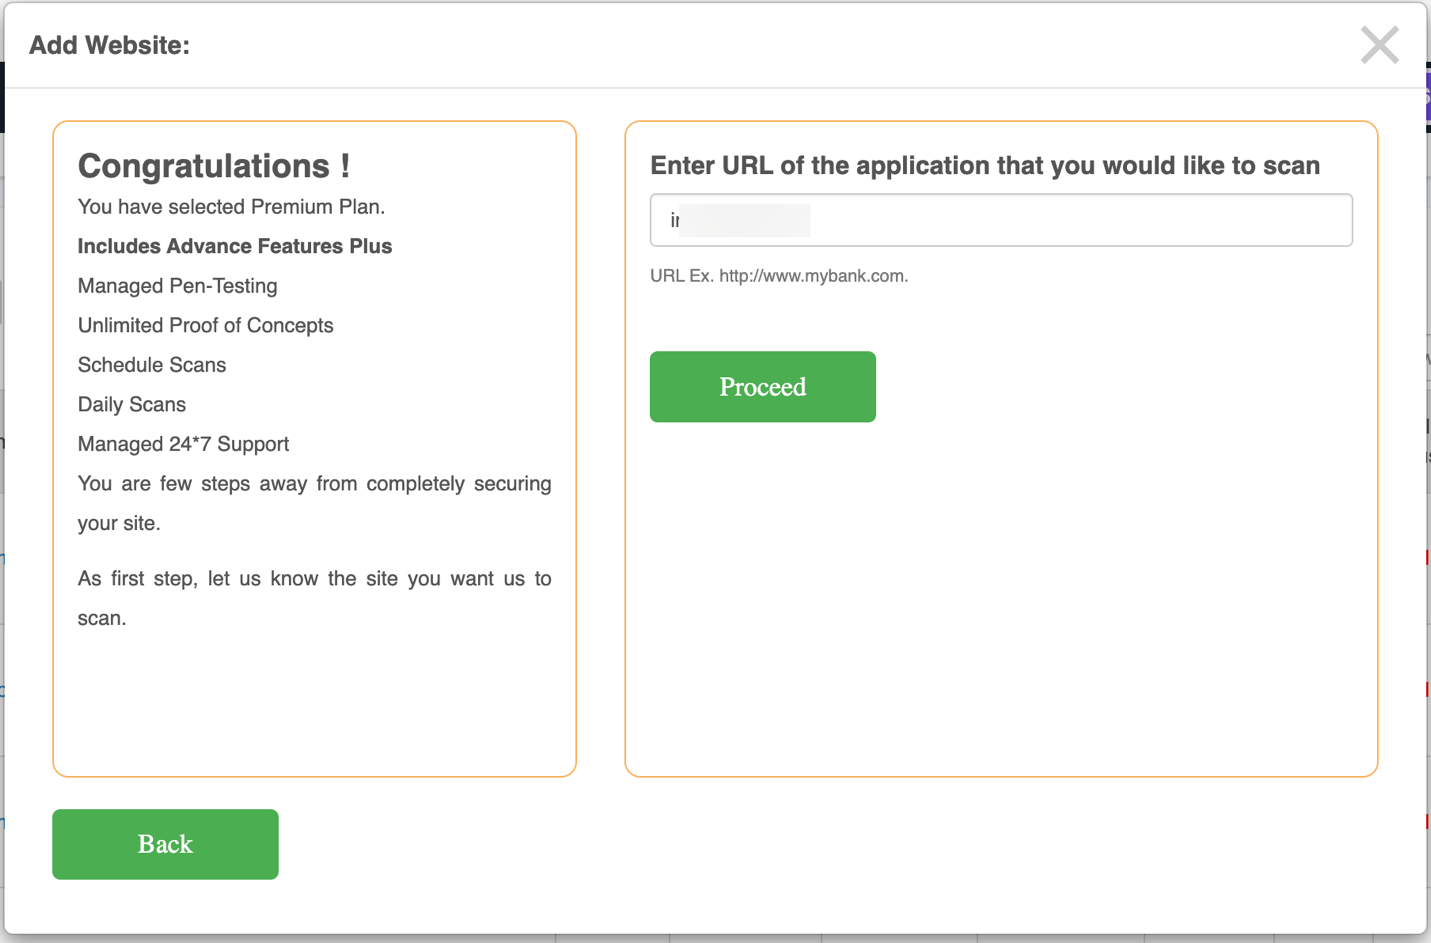
Provide the domain URL in the Enter Domain Name field and click Proceed.
A pop-up verifies the URL from the backend and requests authentication details. Enter required details, then click Start Scan.
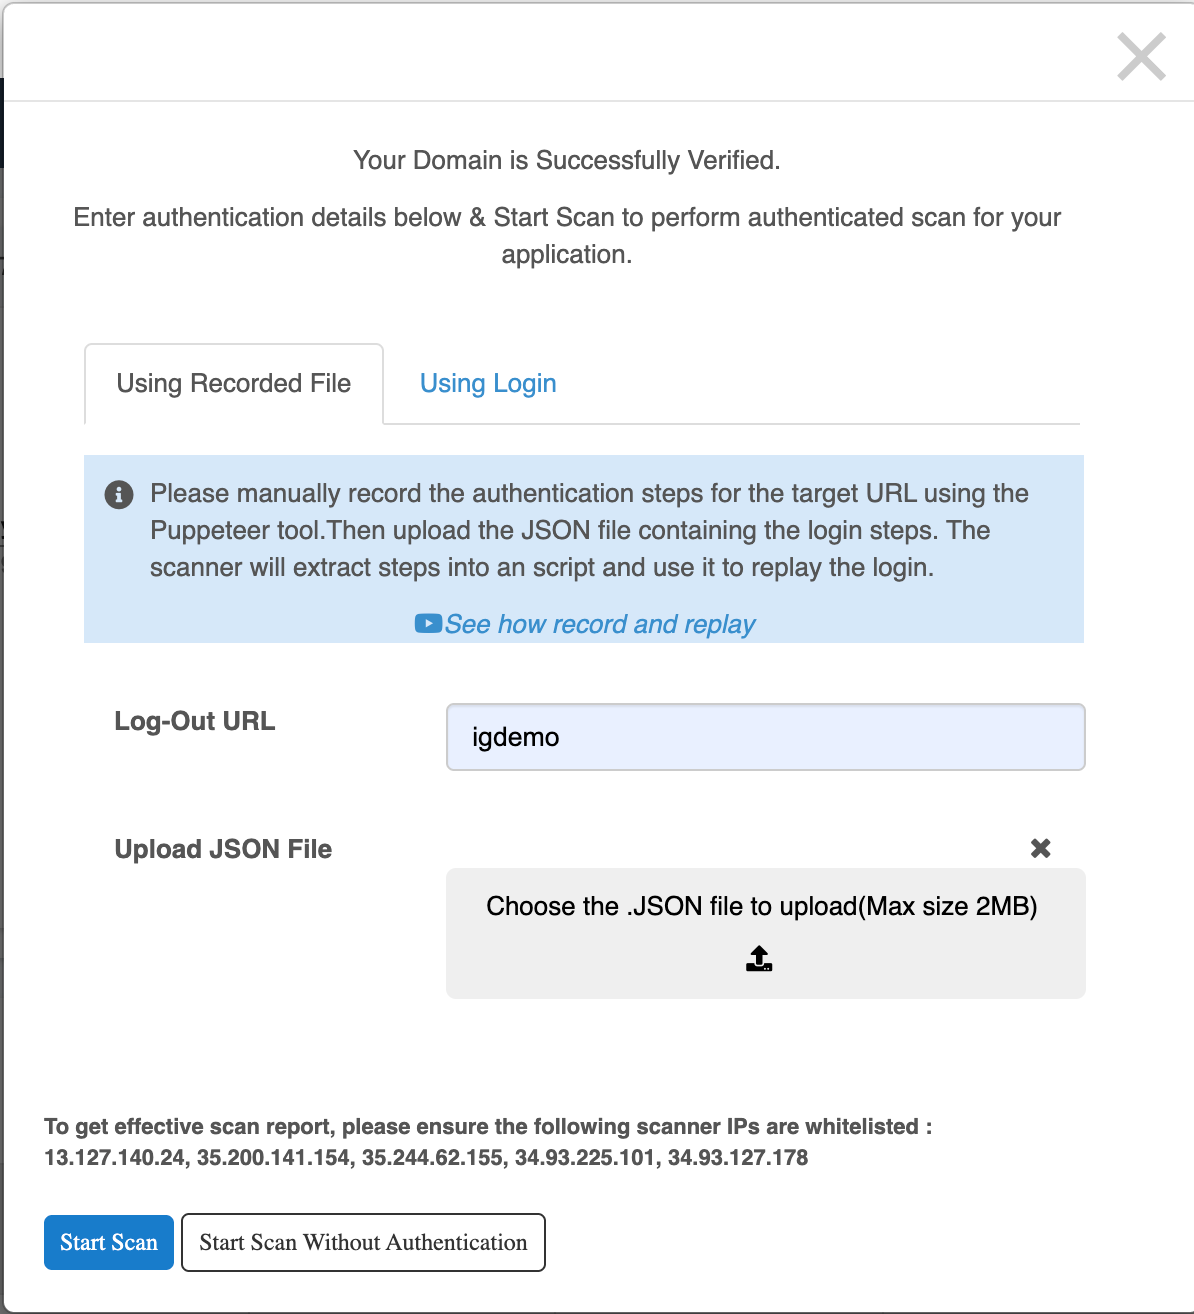
Alternatively, click Start Scan without Authentication to proceed without verification.
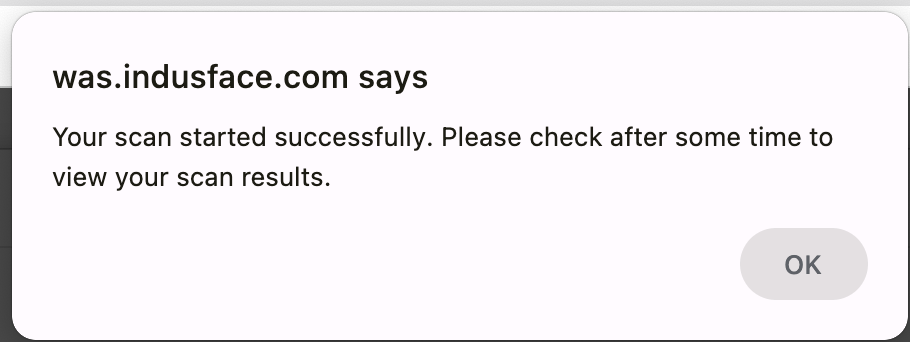
A confirmation message is displayed once the scan starts successfully.