
Manage Vulnerabilities
Overview
The Vulnerability Dashboard is the central workspace where you view, analyze, and act on security risks across your applications.
It consolidates scan results, shows protection status, and allows you to take remediation actions directly from the interface.
A typical workflow in this dashboard follows this sequence:
- Review overall risk (Open Vulnerabilities)
- Identify patterns (Top Categories)
- Track progress (Previous Scans)
- Run or manage scans
- Take action on individual vulnerabilities
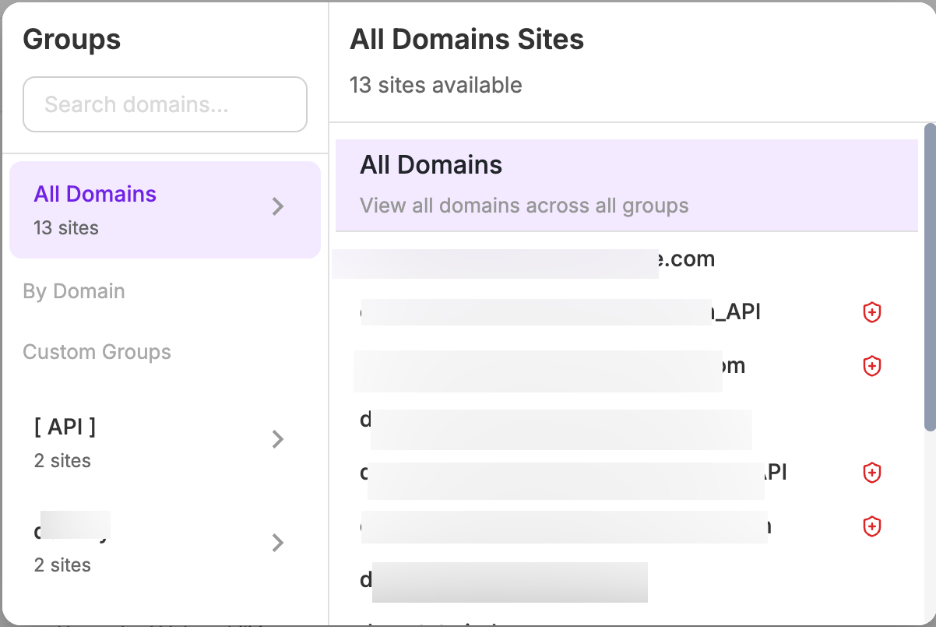
Step 1: Select Application
Before analyzing vulnerabilities, select the required application from the domain/application selector at the top.
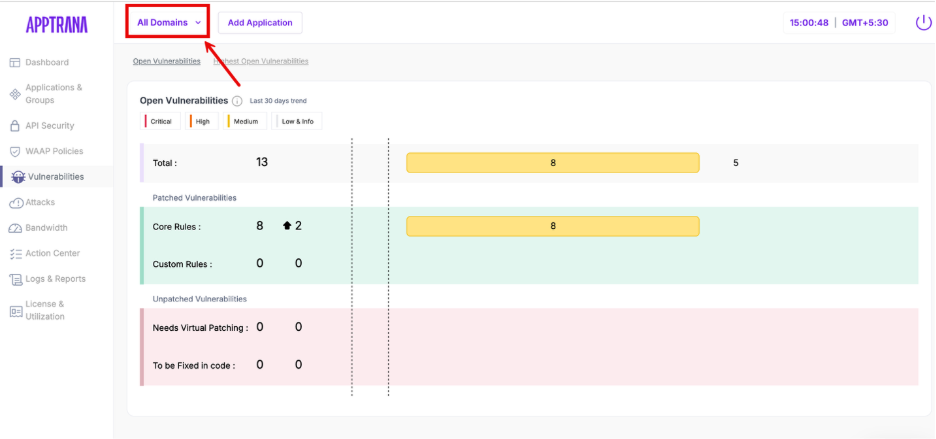
This determines:
- Which application’s vulnerabilities are displayed
- Whether the data corresponds to a web application or API application
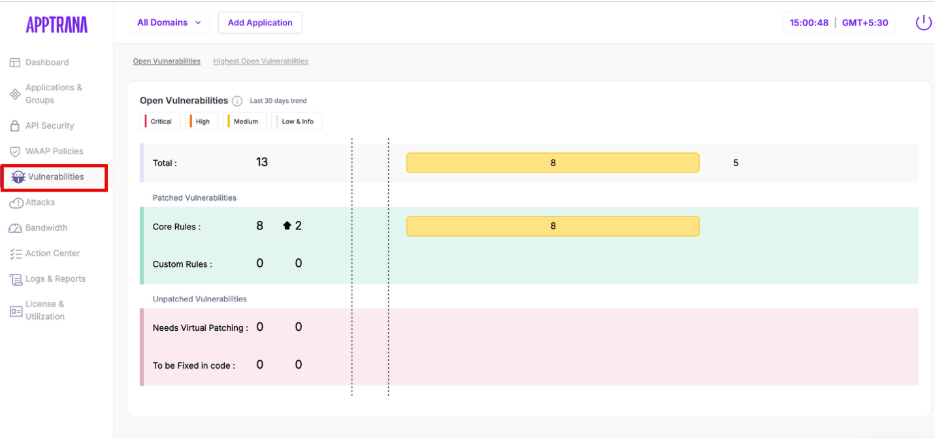
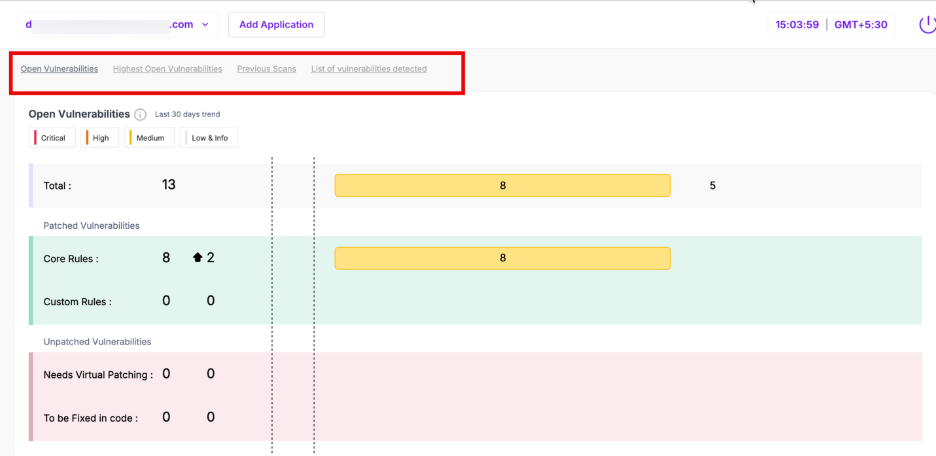
Step 2: Understand Open Vulnerabilities
This section provides a summary of all detected vulnerabilities for the selected application. It helps you quickly understand the current risk exposure and severity distribution.
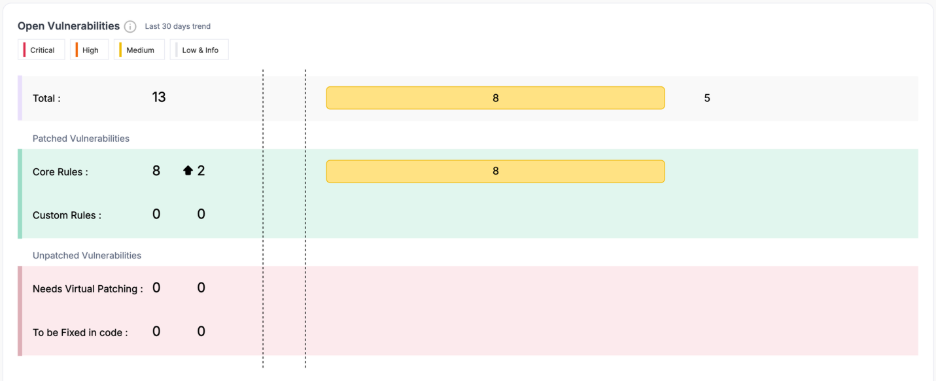
Parameter | Description |
| Total | Total number of vulnerabilities detected |
| Critical / High / Medium / Low & Info | Severity-wise distribution of vulnerabilities |
| Last 30 days trend | Indicates whether vulnerabilities are increasing or decreasing |
| Core Rules | Vulnerabilities patched using platform-managed rules |
| Custom Rules | Vulnerabilities patched using user-requested rules |
| Needs Virtual Patching | Vulnerabilities not yet patched but can be mitigated via WAF |
| To be Fixed in Code | Vulnerabilities that require application-level fixes |
If critical or high vulnerabilities exist under unpatched categories, your application is still exposed.
Step 3: Highest Open Vulnerabilities
This section highlights the top vulnerability categories contributing to risk. Instead of showing individual vulnerabilites, it groups them into patterns.
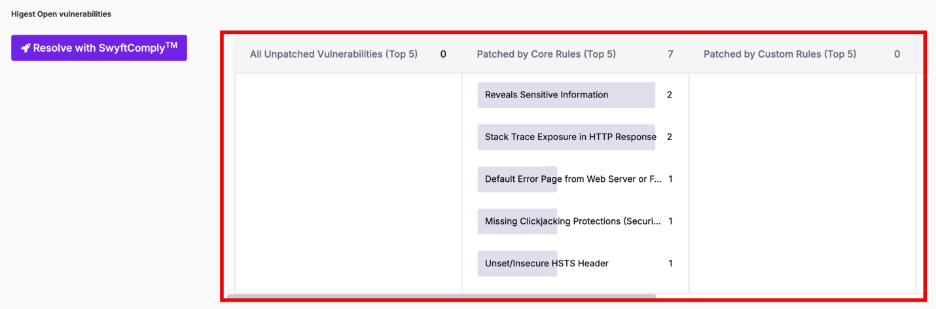
Section | Description |
| All Unpatched Vulnerabilities (Top 5) | Categories with highest unresolved vulnerabilities |
| Patched by Core Rules (Top 5) | Categories mitigated by default protection |
| Patched by Custom Rules (Top 5) | Categories mitigated via custom rules |
Resolve with SwyftComply
The Resolve with SwyftComply option allows you to initiate automated vulnerability remediation directly from this section.
- Applies virtual patches to open vulnerabilities
- Reduces the need for manual rule creation
- Helps accelerate remediation for high-risk categories
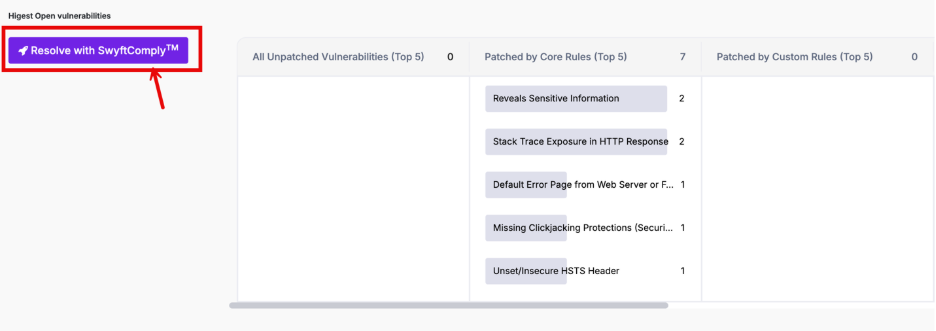
For detailed steps and behavior, refer to SwyftComply Configuration and Usage.
Step 4: Previous Scans
4.1: Previous Scans (Review Scan Trends)
This section displays vulnerability trends across the last 5 scans. It helps you evaluate whether your remediation efforts are effective.
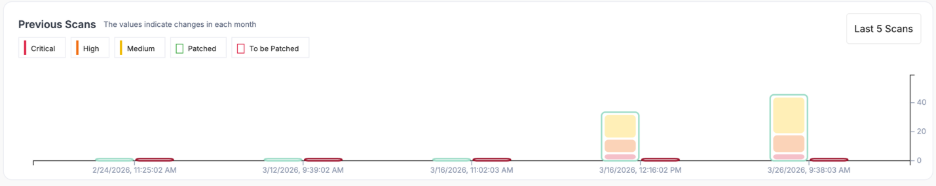
Parameter | Description |
| Critical / High / Medium | Severity distribution per scan |
| Patched | Number of vulnerabilities resolved |
| To be Patched | Number of vulnerabilities still open |
| Scan Timeline | Date and time of each scan |
4.2 Manage Scan & Remediation
This section displays the current scan status, historical execution details, and available actions for vulnerability detection and remediation.
The available panels vary based on the type of application selected (Web or API).
4.2.1 Web Application Context
When a Web application is selected, this section displays the following panels:
- AUTO SCAN
- MANUAL PENTESTING
- SWYFTCOMPLY
These panels together enable automated scanning, manual testing, and autonomous patching to ensure vulnerabilities are continuously identified and addressed.
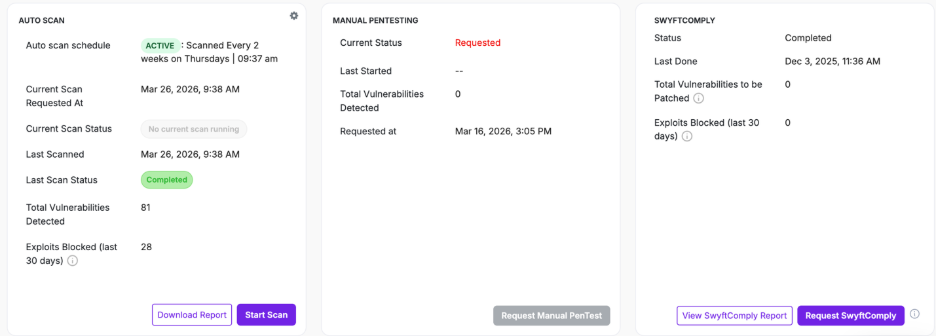
Auto Scan
The AUTO SCAN panel provides details about scheduled and on-demand vulnerability scans for the selected application.
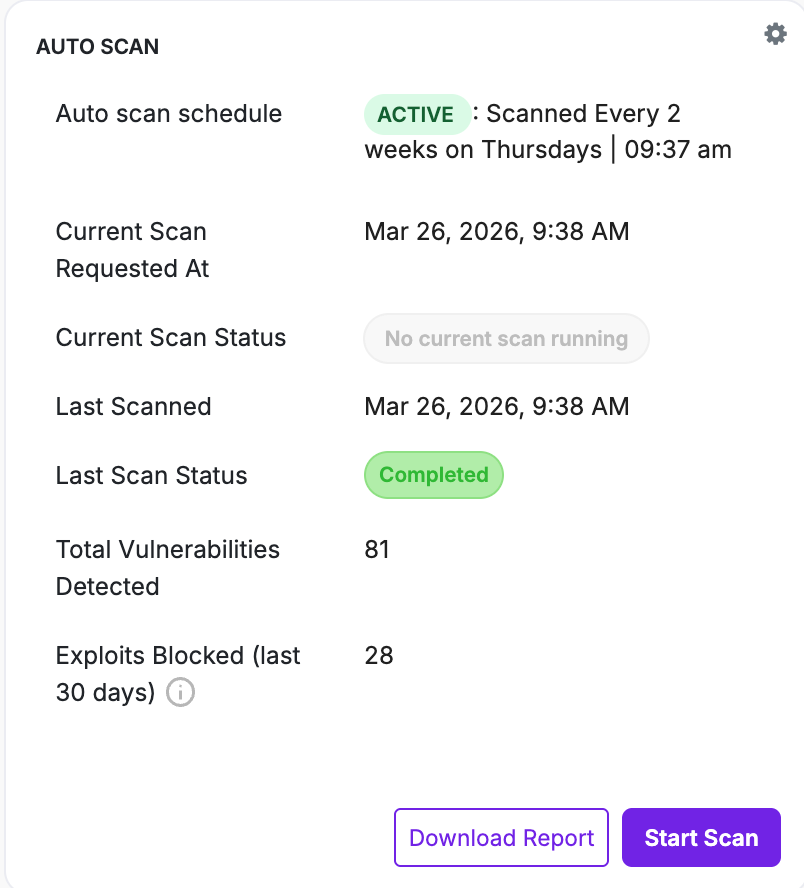
It reflects both:
- Scan execution status
- Latest scan results
Field | Description |
| Auto scan schedule | Displays configured scan frequency and timing |
| Current Scan Requested At | Timestamp when the latest scan was triggered |
| Current Scan Status | Indicates if a scan is currently running |
| Last Scanned | Timestamp of the last completed scan |
| Last Scan Status | Status of the last scan |
| Total Vulnerabilities Detected | Number of vulnerabilities identified |
| Exploits Blocked (last 30 days) | Number of attacks mitigated |
Actions
Action | Description |
| Start Scan | Initiates an immediate scan |
| Download Report | Downloads scan results in PDF format |
Accessing Auto Scan Configuration
Click the settings icon in the AUTO SCAN panel to open the Scan Configuration window
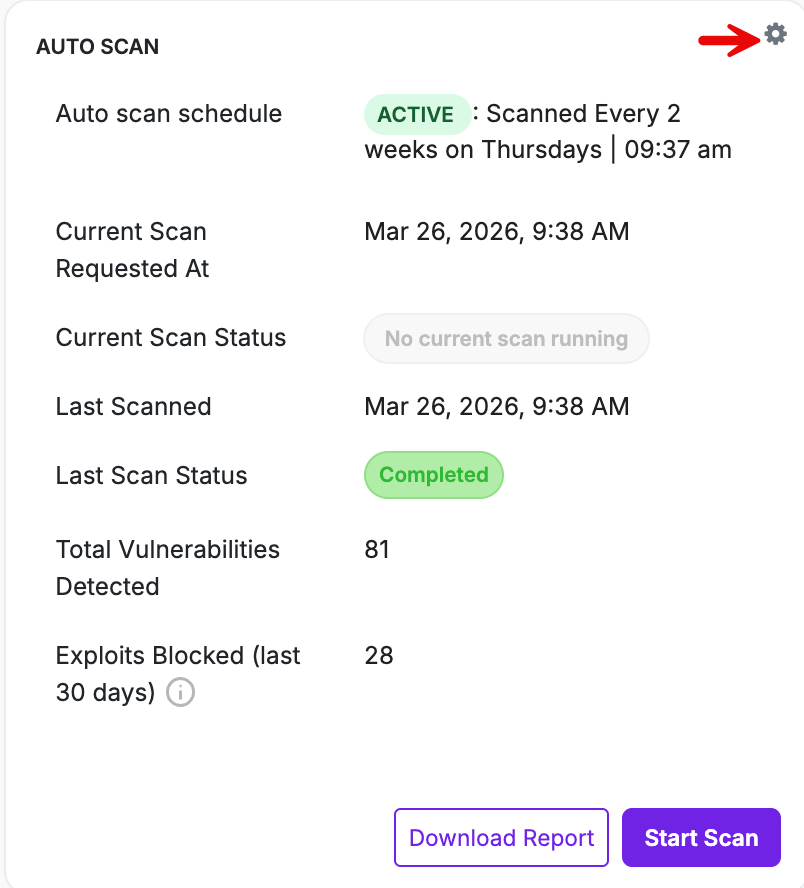
This is where:
- Auto Scan behavior is defined
- Global Scan settings are configured
Scan configuration can be defined at two levels:
- Application-Level Scan Configuration
- Global Scan Configuration
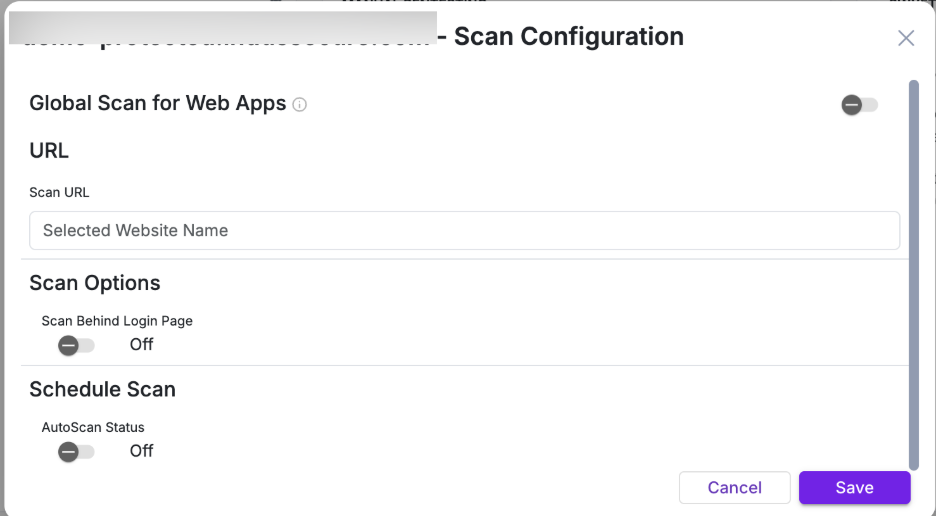
1. Application-Level Scan Configuration
Application-level configuration controls how scans are executed for a specific application.
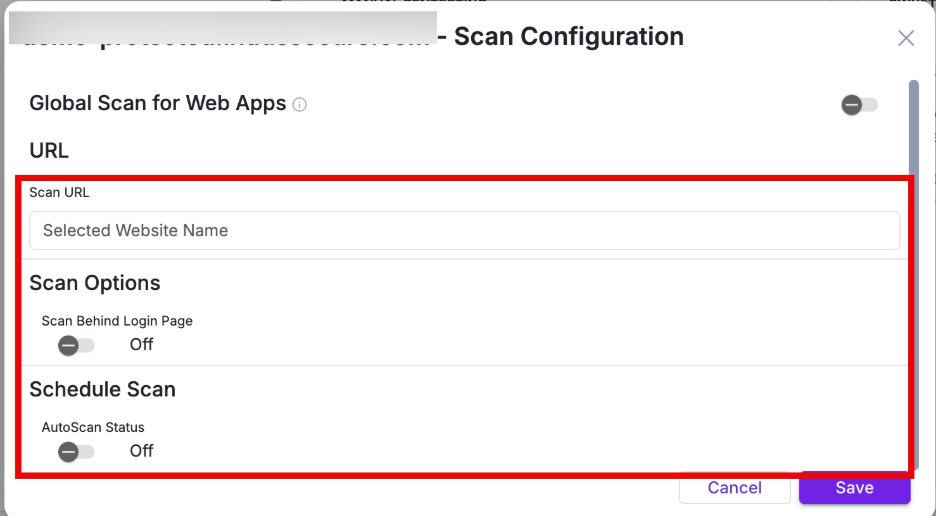
Parameter | Description |
| Scan URL | Target URL for the application scan |
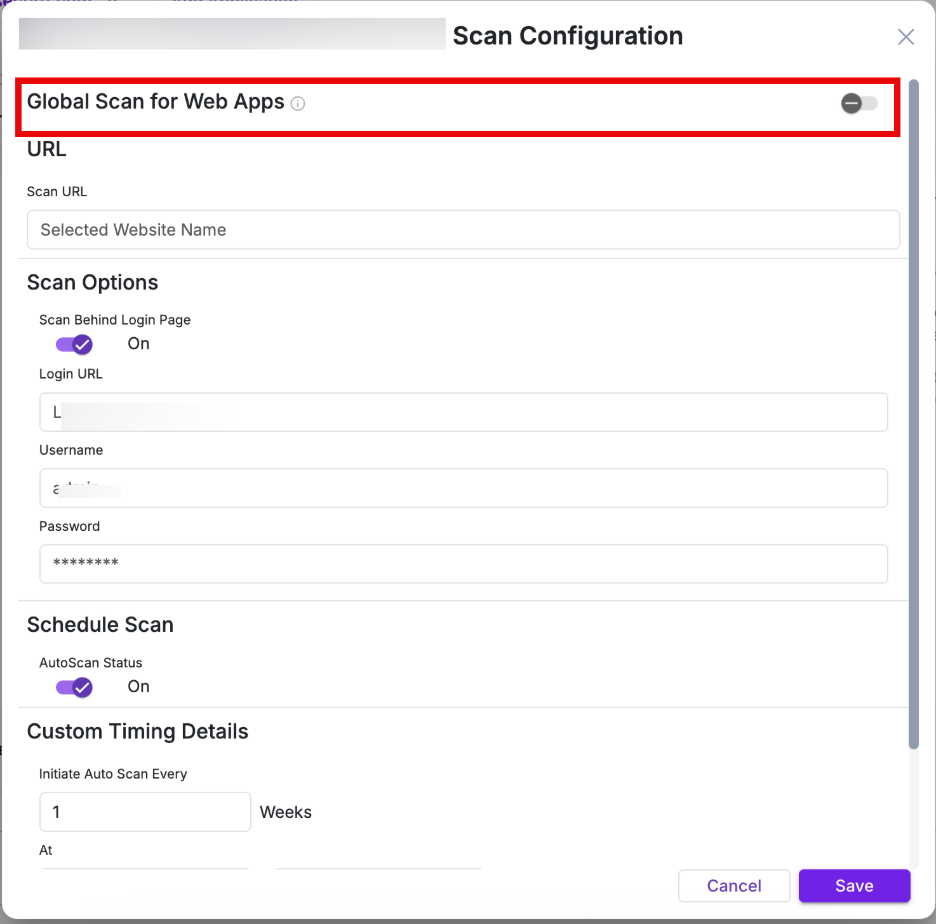
| Scan Behind Login Page | Enables authenticated scanning when turned on |
| AutoScan Status | Enables or disables scheduled scanning for the application |
| Initiate Auto Scan Every | Defines scan frequency in weeks |
| Time (24 hrs format) | Specifies the scan start time |
| Repeat On | Selects the day(s) on which the scan should run |
Behavior
- Applies only to the selected application
- Overrides Global Scan settings if both are configured
- Can be used for critical applications requiring different scan frequency
Global Scan Configuration
Enable the “Global Scan for Web Apps” toggle in the Scan Configuration to apply a centralized scan schedule across all web applications.
Global Scan allows you to define a centralized scan schedule across multiple web applications, eliminating the need to configure scans individually.
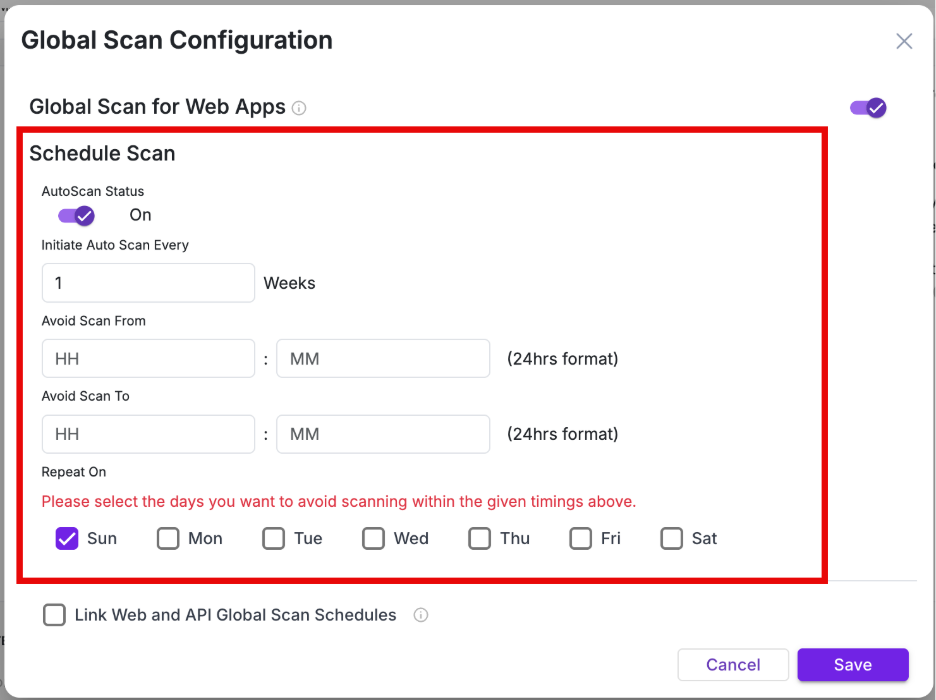
Parameter | Description |
| AutoScan Status | Enables or disables global scan scheduling |
| Initiate Auto Scan Every | Defines scan frequency (in weeks) |
| Avoid Scan From / To | Defines time window during which scans should not run |
| Repeat On | Selects days for scan execution |
| Link Web and API Global Scan Schedules | Applies a single schedule across both Web and API applications |
Scheduling Modes
1. Separate Scheduling - Web and API applications can have independent schedules (Useful when APIs require different scan frequency)
2. Linked Scheduling - A single schedule is applied across both Web and API applications
Enabled using “Link Web and API Global Scan Schedules”
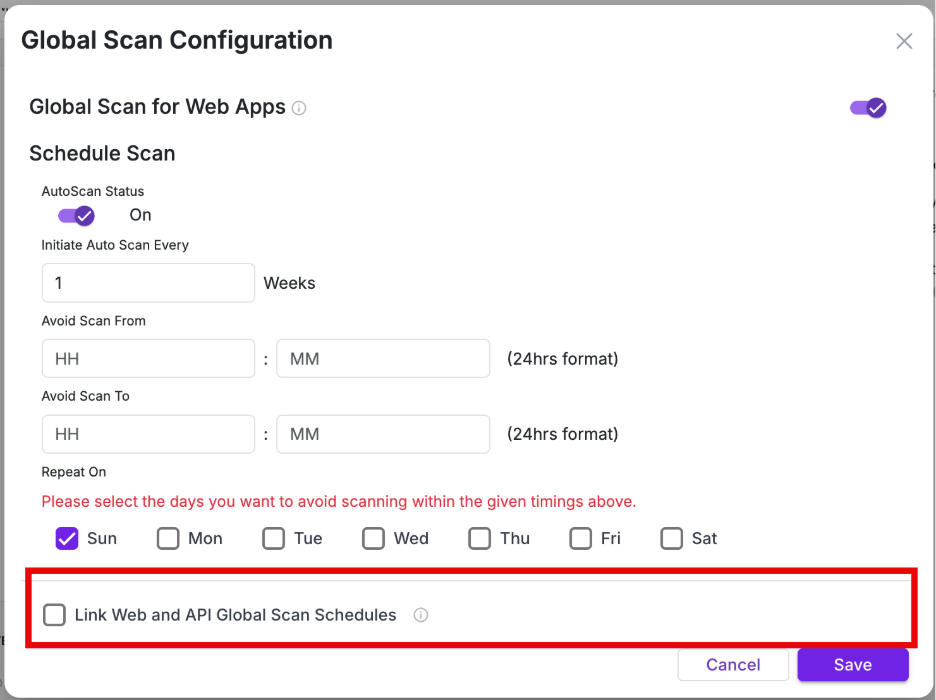
Use this only when both application types require the same scan timing.
Global Scan Behavior: Web Applications
Newly onboarded web applications are automatically included in the global scan schedule
Example:
If a scan is scheduled every Thursday, all newly added web applications will follow the same schedule.
Manual Pentesting
The MANUAL PENTESTING panel allows you to request a manual penetration test for deeper vulnerability analysis.
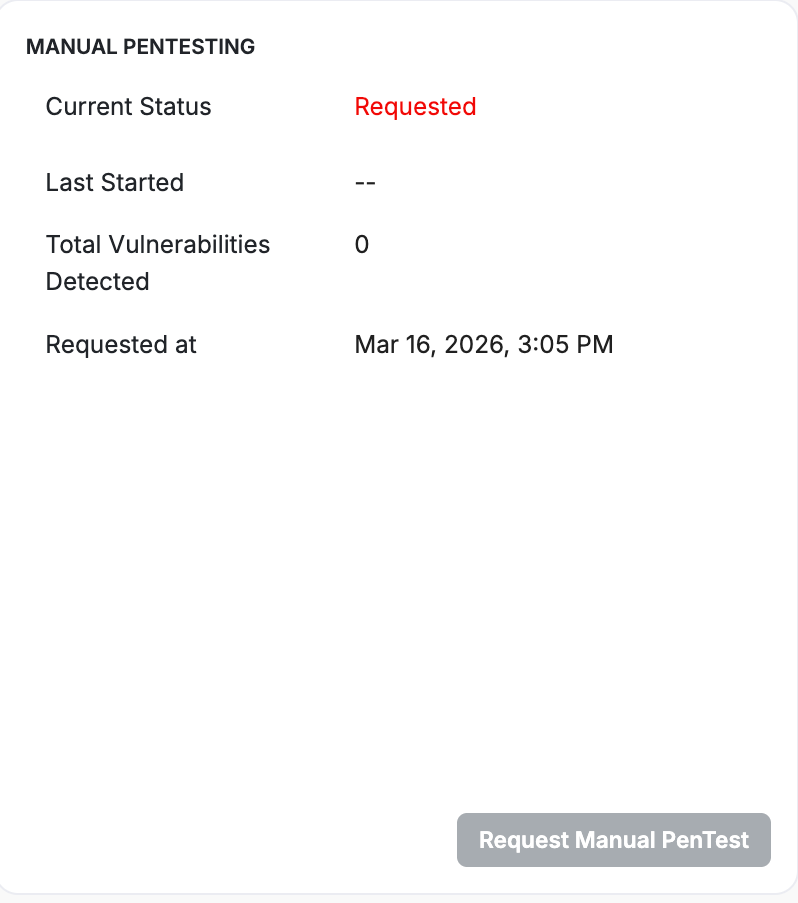
Manual Pentesting complements automated scanning by uncovering complex, business logic, and context-driven vulnerabilities that require expert validation.
Field | Description |
| Current Status | Status of the pentest request |
| Last Started | Timestamp when testing began |
| Total Vulnerabilities Detected | Number of vulnerabilities identified |
| Requested at | Timestamp when the request was submitted |
Action | Description |
| Request Manual PenTest | Initiates a manual penetration testing request |
- Click Request Manual PenTest.
- Result: A confirmation pop-up appears.
- Provide the confirmation and the request will be forwarded to our AppTrana team.
Behavior
- Requests are handled by the AppTrana team
- Results are updated in the dashboard after completion
SWYFTCOMPLY
The SWYFTCOMPLY panel provides autonomous virtual patching. It ensures identified vulnerabilities are virtually patched without requiring manual intervention.
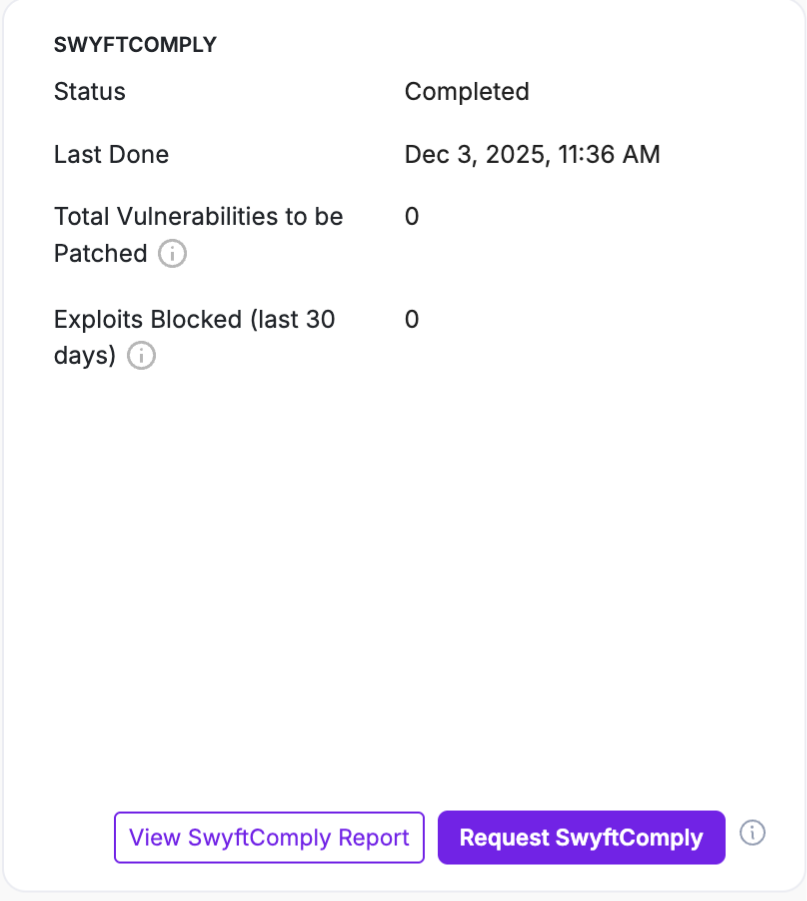
For detailed steps and behavior, refer to SwyftComply for Auto Scan & Manual Pentest
4.2.2: API Context
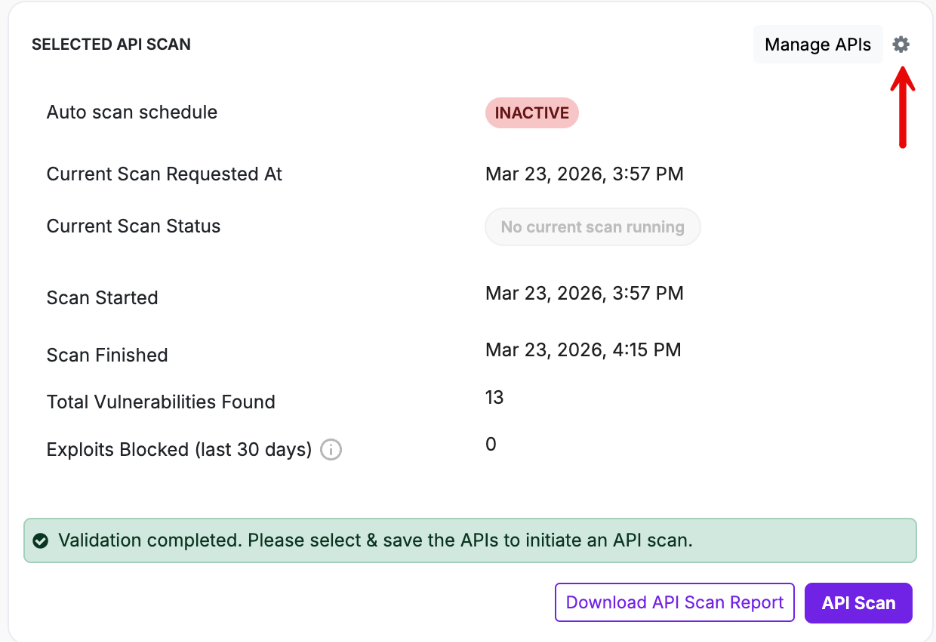
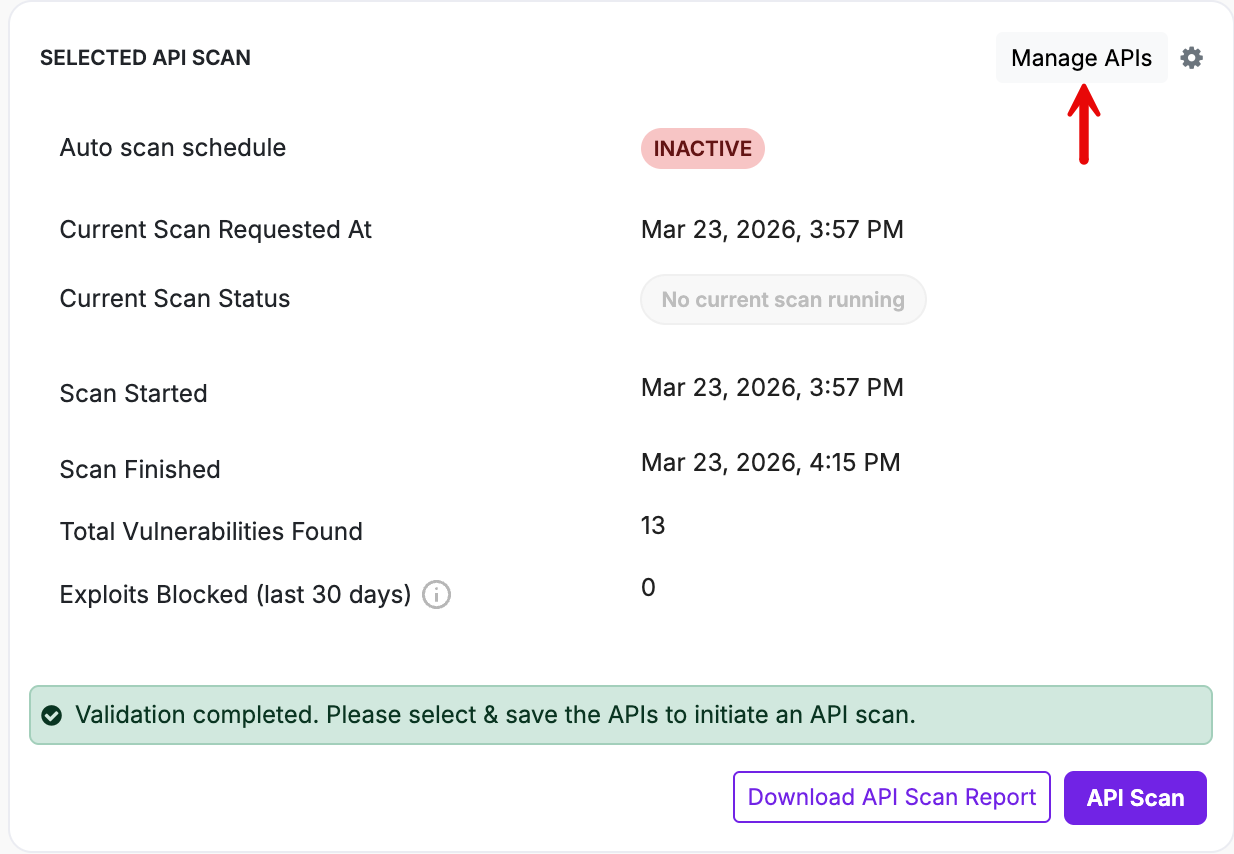
Selected API Scan
- From the application menu, select the API application.
- Navigate to Selected API Scan field.
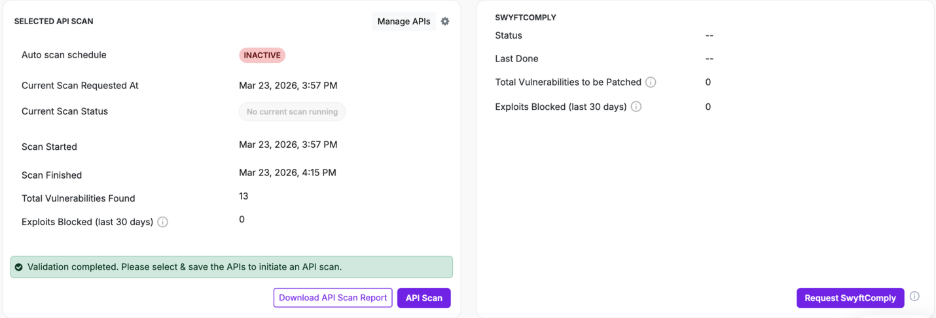
This section provides details about API scan execution and allows you to configure and initiate API scans.
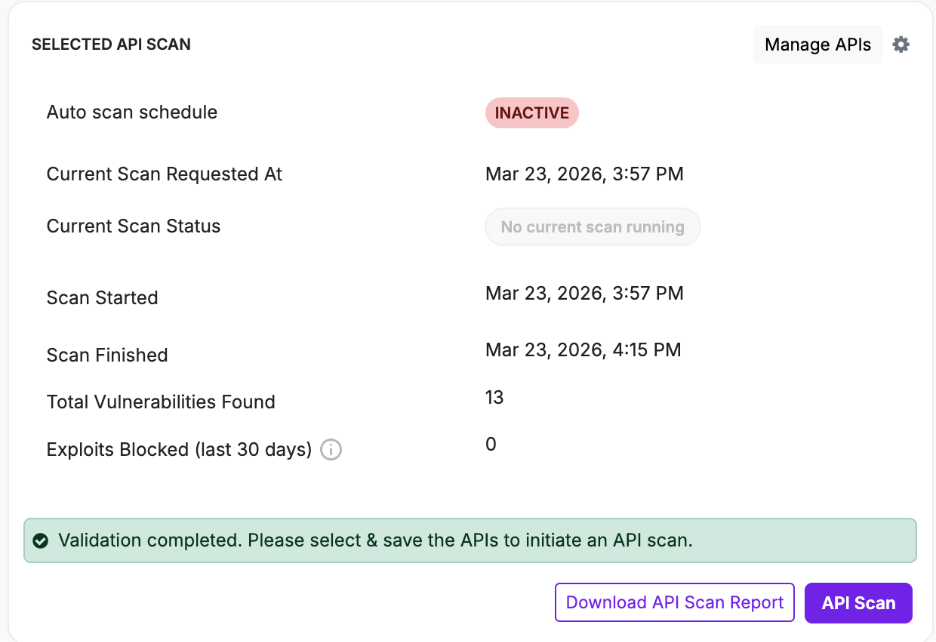
Field | Description |
| Auto scan schedule | Indicates whether API scan scheduling is active or inactive |
| Current Scan Requested At | Timestamp of the most recent scan request |
| Current Scan Status | Indicates if a scan is currently running |
| Scan Started | Start time of the last scan |
| Scan Finished | Completion time of the last scan |
| Total Vulnerabilities Found | Number of vulnerabilities identified |
| Exploits Blocked (last 30 days) | Number of attacks mitigated |
Action | Description |
| API Scan | Initiates an API scan |
| Download API Scan Report | Downloads the API scan report |
| Manage APIs | Opens API configuration to upload or modify APIs. See API Configuration in AppTrana for more details. |
API Scan Configuration
Clicking settings icon opens the Scan Configuration window for API applications. This window allows you to define scan behavior and scheduling for API applications.
The configuration window contains the following sections:
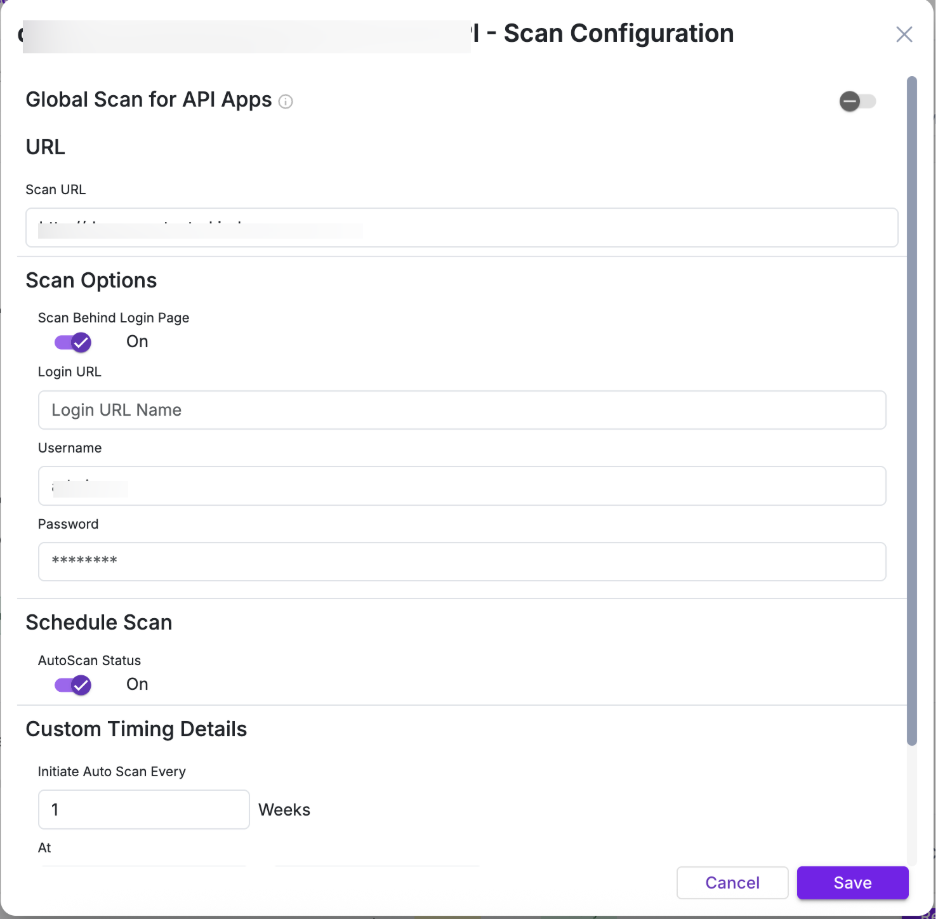
Section | Parameter | Description |
| Global Scan for API Apps | Toggle | Enables or disables global scan scheduling for API applications |
| URL | Scan URL | Displays the selected API application |
| Scan Options | Scan Behind Login Page | Enables authenticated scanning if required |
| Schedule Scan | AutoScan Status | Enables or disables scheduled scans |
| Schedule Scan | Initiate Auto Scan Every | Defines scan frequency in weeks |
| Schedule Scan | Avoid Scan From / To | Defines time window during which scans should not run |
| Schedule Scan | Repeat On | Selects days for scan execution |
| Schedule Scan | Link Web and API Global Scan Schedules | Applies a unified schedule across Web and API applications |
Global Scan settings defined here control scheduling across API applications
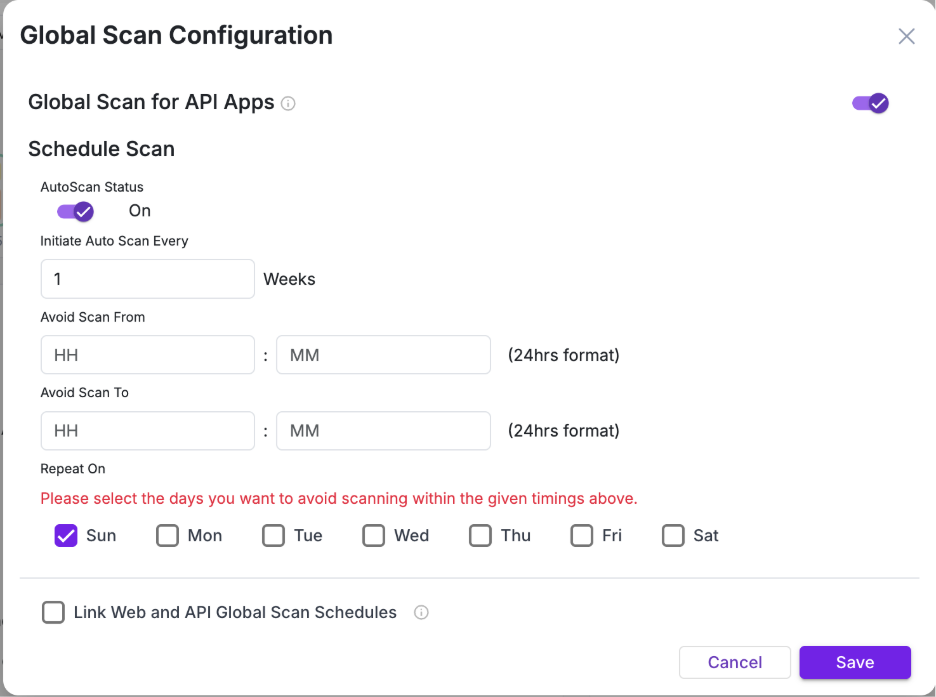
Schedule Scan
This section defines when and how frequently API scans are executed.
Parameter | Description |
| AutoScan Status | Enables or disables global scan scheduling for API applications |
| Initiate Auto Scan Every | Defines how often the scan runs (in weeks) |
| Avoid Scan From / To | Specifies a time window during which scans should not run |
| Repeat On | Selects the days when scan restrictions (avoid window) apply |
Link Web and API Global Scan Schedules
Enable “Link Web and API Global Scan Schedules” to apply a single unified scan schedule across both Web and API applications.
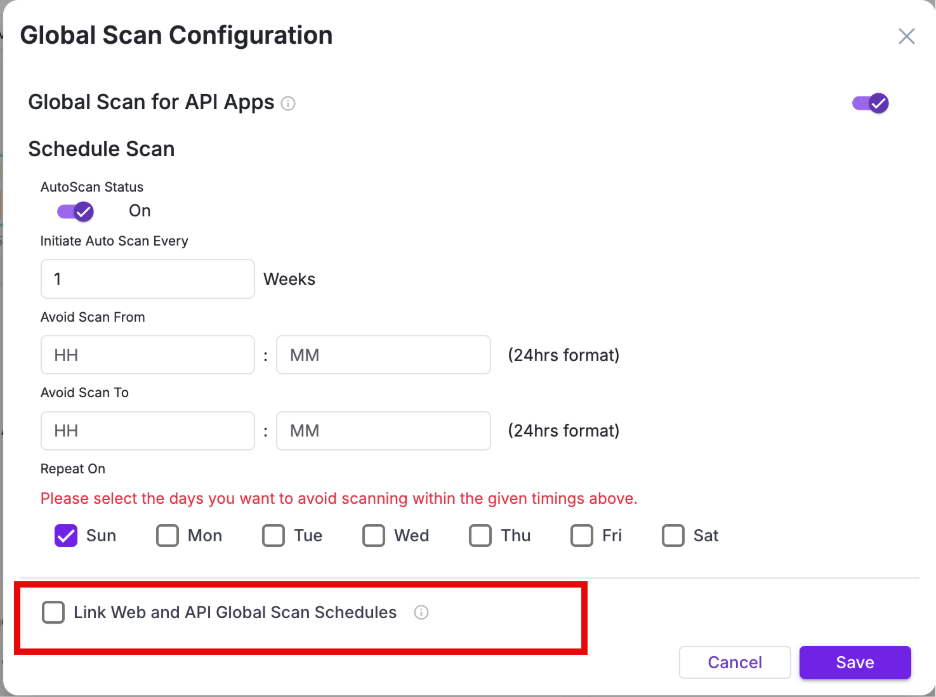
- When enabled → Web and API scans follow the same schedule
- When disabled → API scans follow their own independent schedule
Global Scan is not applied immediately after onboarding for API applications. Global Scan is automatically applied to web applications upon onboarding, whereas API applications require initial configuration and a first successful scan before being included.
Manage API
- To onboard and configure your API, go to Selected API Scan and click Manage APIs.
- You will be redirected to API Security → API Scanning.
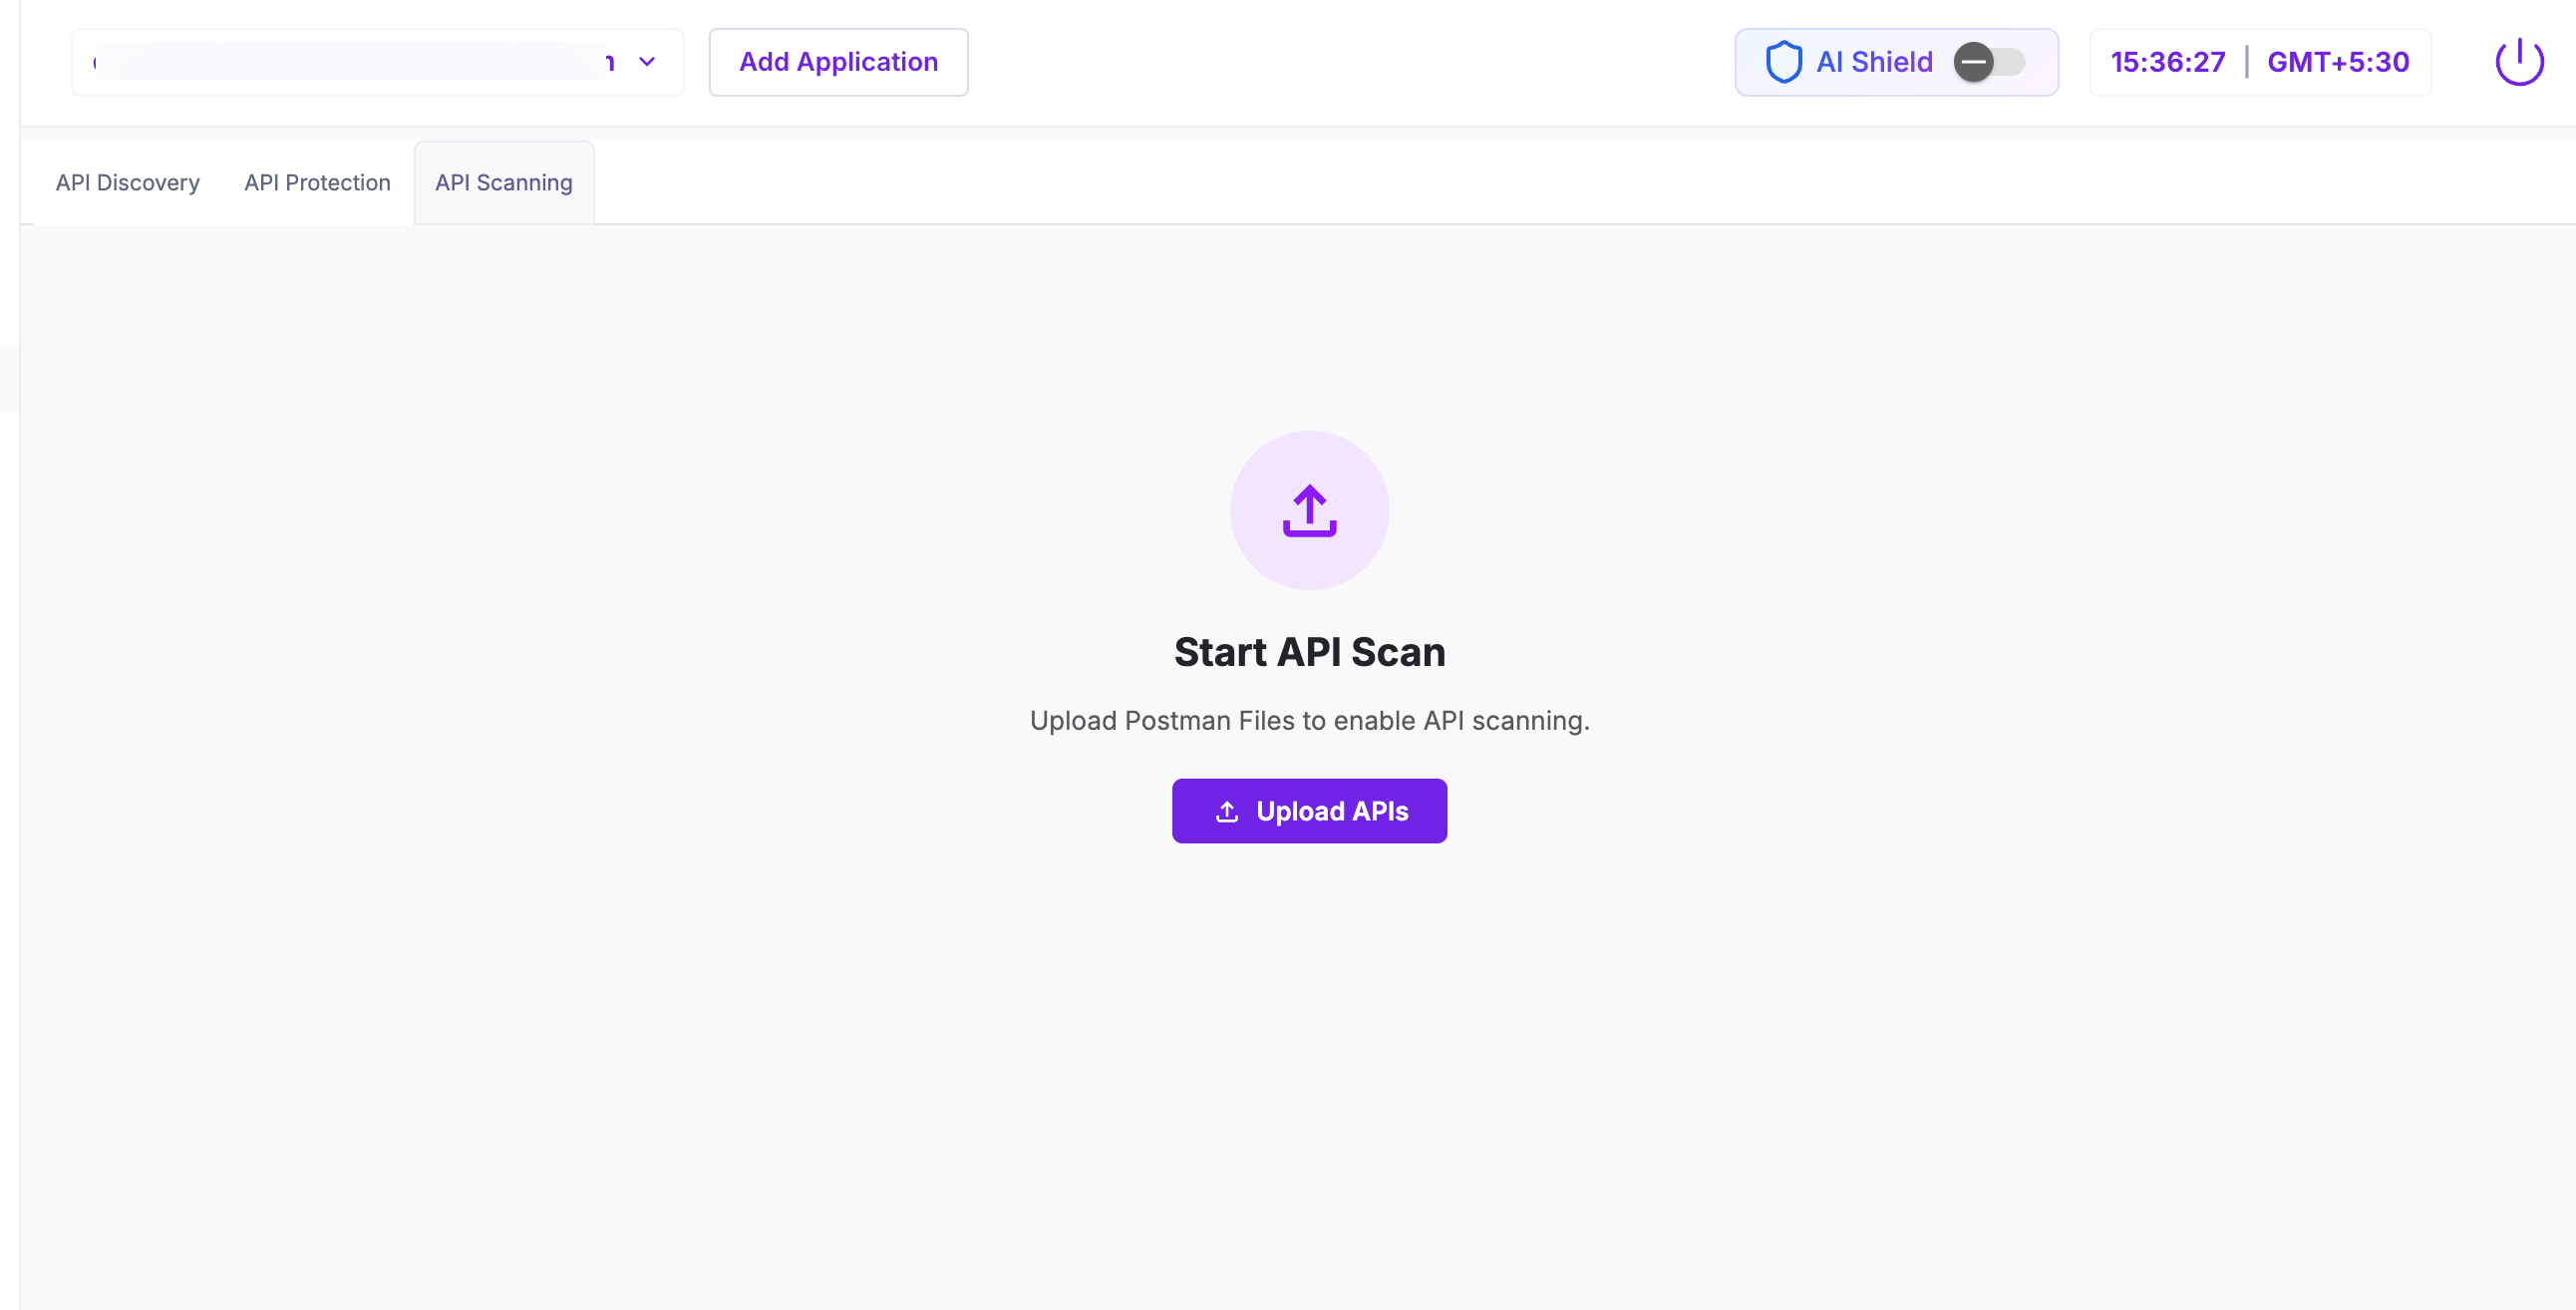
Click here to follow the step-by-step API onboarding process.
SwyftComply
The SWYFTCOMPLY panel provides autonomous virtual patching of API vulnerabilities

For detailed steps and behavior, refer to SwyftComply for API Scan
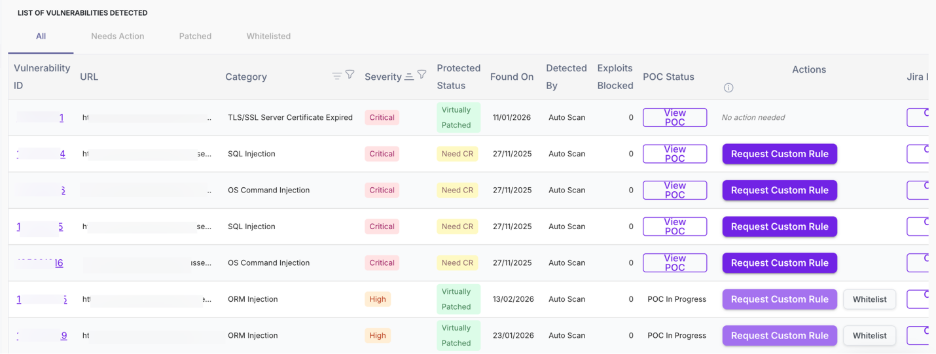
Step 5: List of Vulnerabilities Detected
This is the primary action section where vulnerabilities are reviewed and remediated.
Use the tabs to filter vulnerabilities based on their current status:

Tab | Description |
| All | Displays all vulnerabilities |
| Needs Action | Displays vulnerabilities requiring remediation |
| Patched | Displays vulnerabilities that are already protected |
| Whitelisted | Displays vulnerabilities marked as safe or ignored |
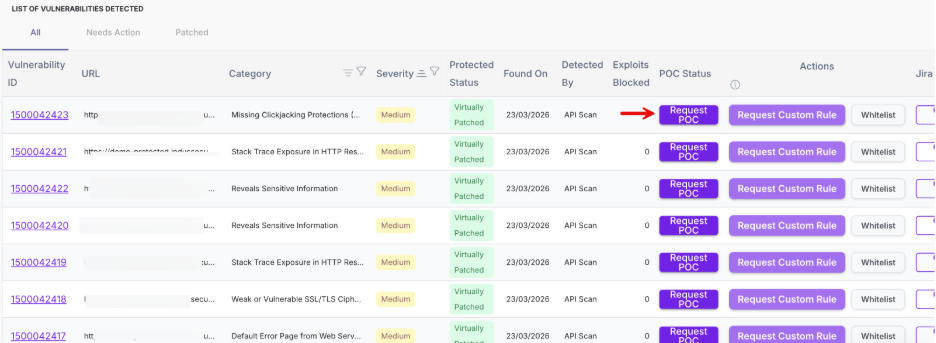
5.1 View all vulnerabilities
This section provides a detailed, row-level view of all detected vulnerabilities, enabling you to review, validate, and take action on each vulnerabilities.
Each row represents a vulnerability with the following details:
Column | Description |
| Vulnerability ID | Unique identifier assigned to each vulnerability |
| URL | Affected endpoint |
| Category | Type of vulnerability |
| Severity | Risk level (Critical / High / Medium) |
| Protected Status | Indicates if vulnerability is patched |
| Found On | Date when vulnerability was detected |
| Detected By | Source of detection (Auto Scan / Manual) |
| Exploits Blocked | Number of blocked attempts |
| POC Status | Availability of proof of concept |
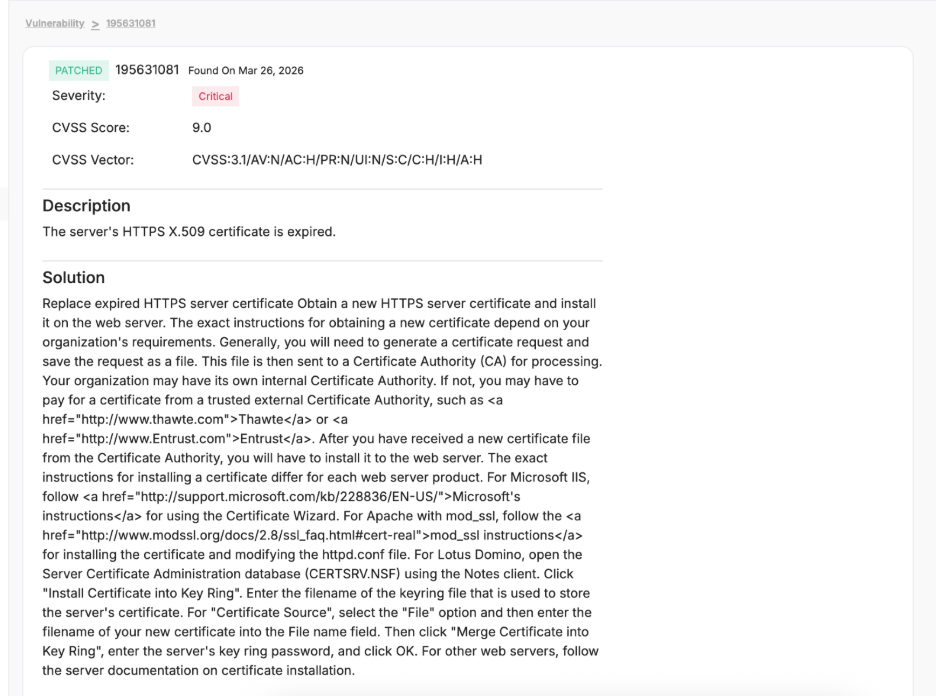
Click on the Vulnerability ID to open the detailed view of the selected vulnerability.
Request POC
Click Request POC to validate whether a vulnerability is practically exploitable. This helps you understand the real impact before taking remediation actions.
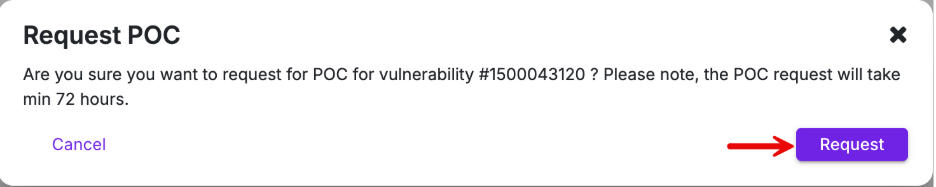
When you click Request POC, a confirmation pop-up appears asking you to proceed with the request.
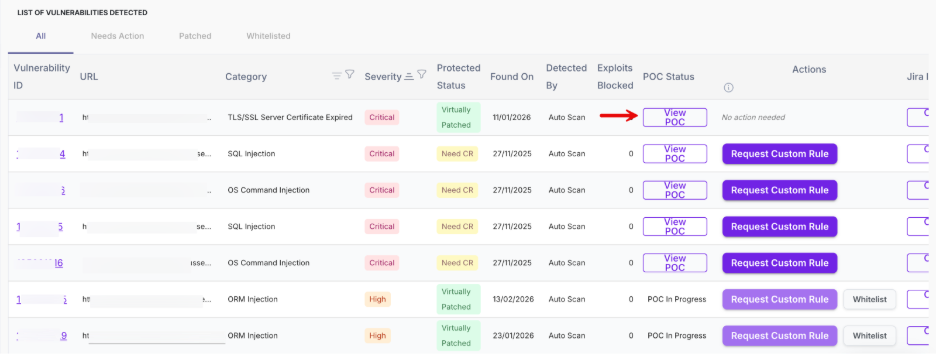
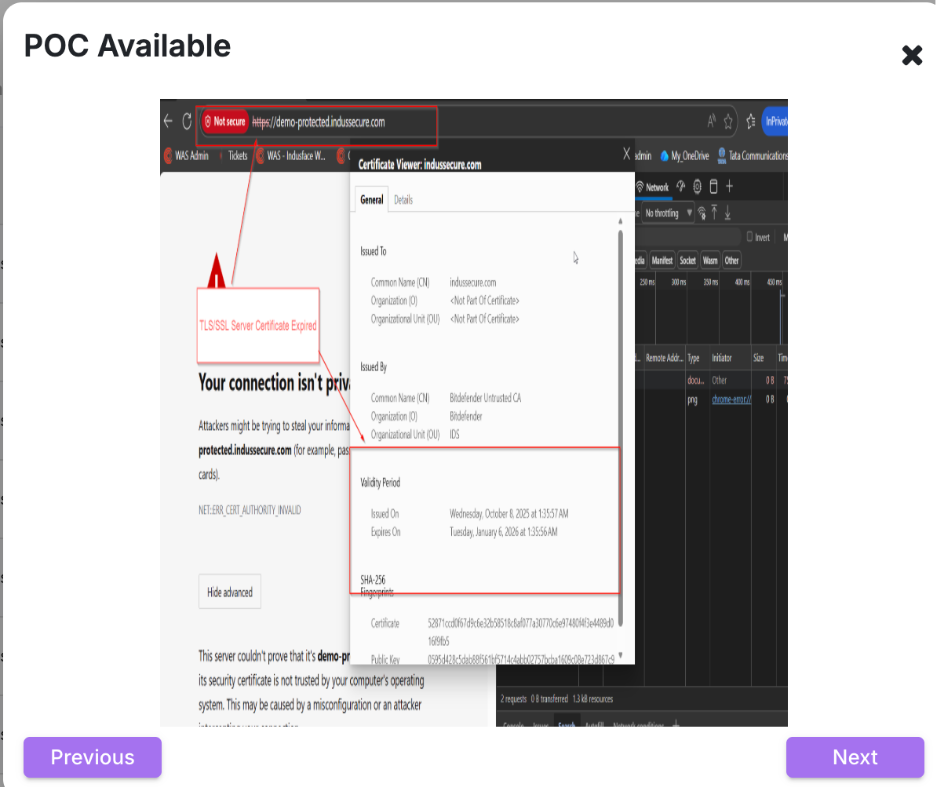
Click View POC once it is generated to review detailed evidence demonstrating how the vulnerability can be exploited.
The POC may include request-response data, payloads, or visual proof such as browser errors, certificate issues, or application behavior that confirms the vulnerability.
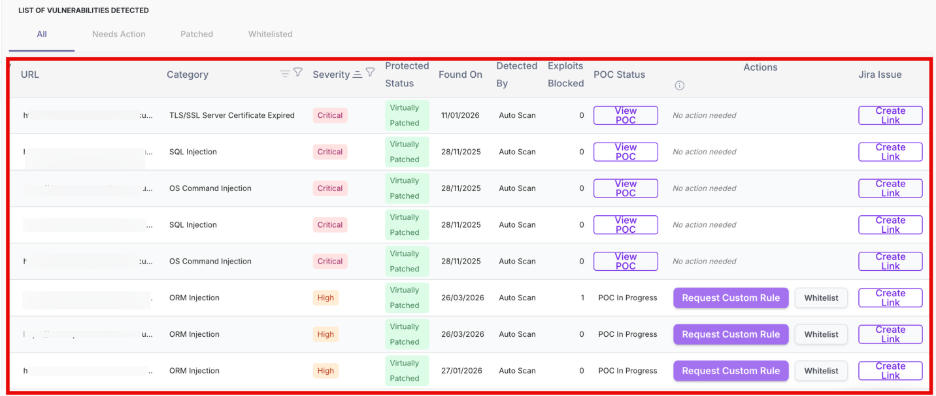
Actions
Use the available actions to validate findings, apply protection, or track remediation based on your workflow.
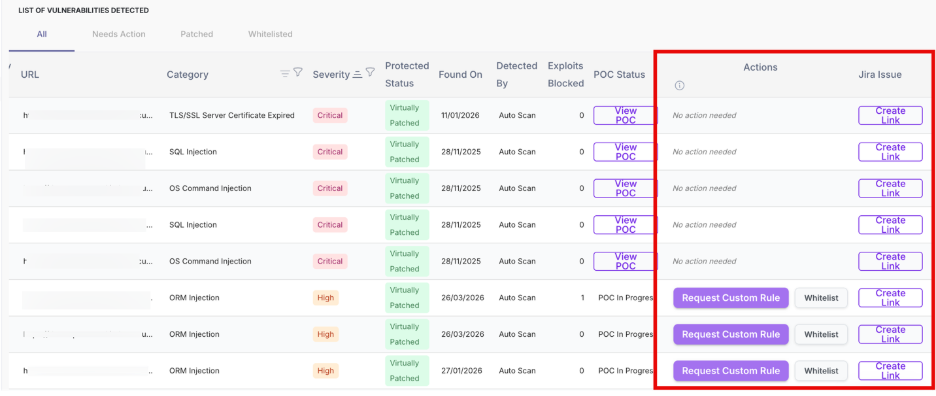
You can take the following actions to validate and remediate vulnerabilities:
Action | Description |
| Request Custom Rule | Request protection via WAF |
| Whitelist | Mark vulnerability as ignored |
| Create Link | Create Jira issue for tracking |
5.2 Needs Action
The Needs Action tab displays vulnerabilities that are not yet fully remediated and require user or platform intervention.
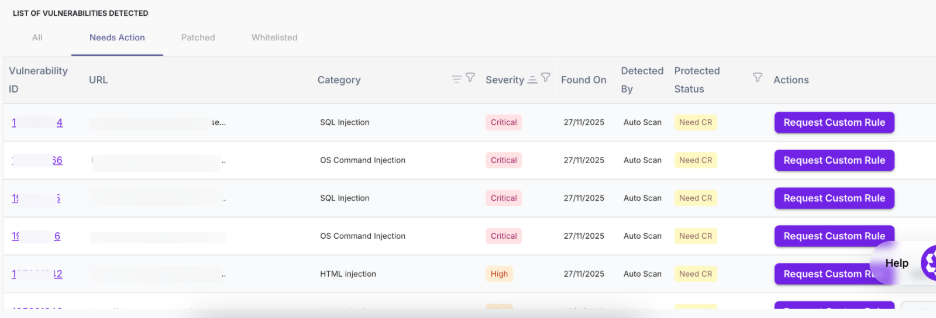
Column | Description |
| Vulnerability ID | Unique identifier for each vulnerability |
| URL | Affected endpoint |
| Category | Type of vulnerability |
| Severity | Risk level indicating priority |
| Found On | Date when the vulnerability was detected |
| Detected By | Source of detection |
| Protected Status | Indicates pending action (e.g., Need CR, Not Protected) |
| Actions | Request Custom Rule, View/Request POC, Whitelist |
Click on the Vulnerability ID in the Needs Action tab to open the detailed view of the selected vulnerability.
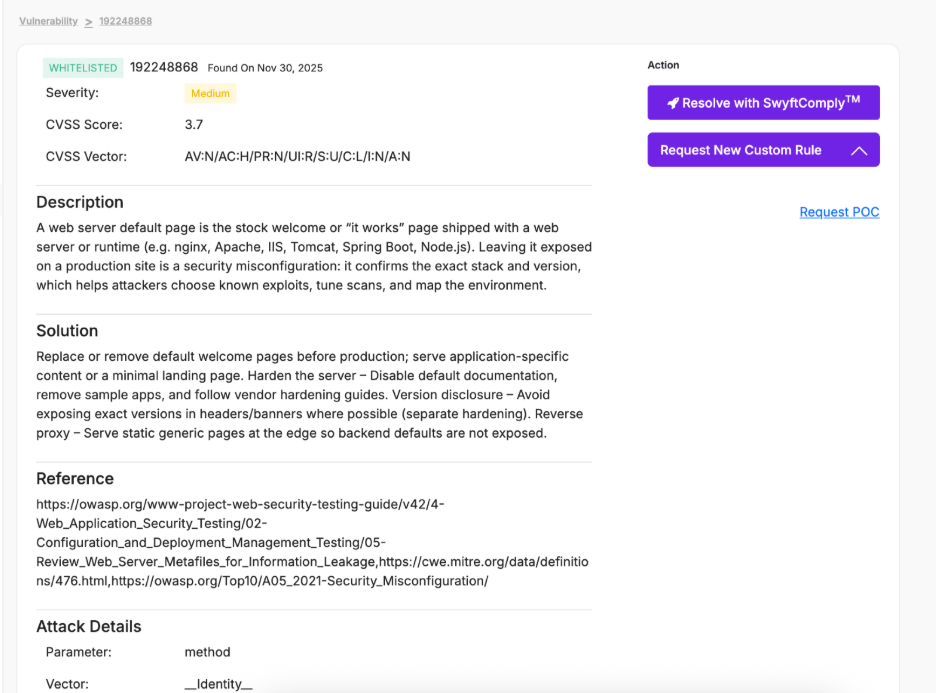
Action | Description |
| Resolve with SwyftComply™ | Initiates autonomous virtual patching to protect the vulnerability without requiring code changes |
| Request New Custom Rule | Submits a request to create a WAF rule for targeted mitigation of the vulnerability |
| Request POC | Validates exploitability by generating a proof of concept |
5.3 Patched
The Patched tab displays vulnerabilities that are already protected through AppTrana.
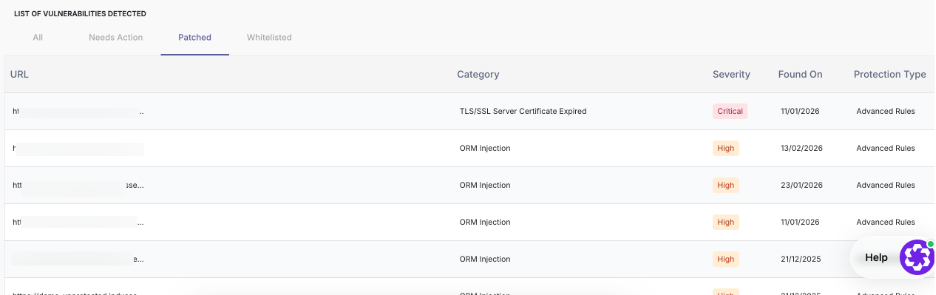
Column | Description |
| URL | Affected endpoint |
| Category | Type of vulnerability |
| Severity | Risk level of the vulnerability |
| Found On | Date when the vulnerability was detected |
| Protection Type | Indicates how the vulnerability is mitigated (Core Rules, Custom Rules, Advanced Rules) |
5.4 Whitelisted
The Whitelisted tab displays vulnerabilities marked as safe or intentionally ignored.
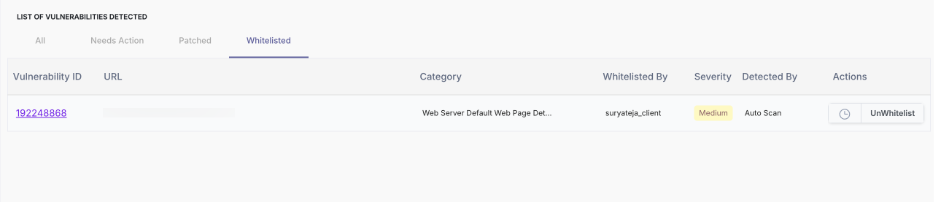
Column | Description |
| Vulnerability ID | Unique identifier for each vulnerability |
| URL | Affected endpoint |
| Category | Type of vulnerability |
| Whitelisted By | User who marked the vulnerability as safe |
| Severity | Risk level of the vulnerability |
| Detected By | Source of detection |
| Actions | Option to remove whitelist (UnWhitelist) |
To learn how to whitelisting vulnerabilities, see Whitelist Vulnerabilities.