AppTrana
Getting Started
Frequently Asked Questions
Product Details
API Scan Coverage for OWASP Top 10
Whitelist Vulnerabilities on the AppTrana WAAP
API Request to Purge CDN Data
Analysis page - Attack Trend Visualisation
Advanced Behavioral DDoS
BOT Protection
Asset Discovery
Customize Application Behavior with Bot Score
Restricted Admin User
Self Service Rules
Configuring Custom Error Page in AppTrana
Enabling SIEM Integration
API Discovery Feature
SwyftComply
Analysis page - Access Trend Visualization
Manage WAAP Email Alerts
Enable and Configure Single Sign-On
WAF Automated Bypass and Unbypass
False Positive Analysis Report on WAAP
Product User Guide
Indusface WAS
Getting Started
Product User Guide
Summary
Dashboard
Malware Monitoring[MM]
Application Audit[AA]
Vulnerability Assessment[VA]
Reports
Settings
Asset Monitoring
New Reporting Structure
Frequently Asked Questions
Feature Summary
AcuRisQ – Risk Management with Advanced Risk Scoring
WAS Consulting License
API Key Based - Scan Log Export
WAS Defacement Checks
SIEM Integration with Sumo Logic
Indusface WAS Scanned Vulnerabilities
Total Application Security
Onboarding Documents
Indusface Newsletter
Indusface Product Newsletter - October 2021
Indusface Product Newsletter- April 2021
Indusface Product Newsletter-January21
Indusface Product Newsletter - June 20
Indusface Product Newsletter - October 19
Indusface Product Newsletter - August 19
Product Newsletter of May 19
Product Newsletter of March 19
Product Newsletter of January 19
WAF Portal Revamp June 18
Product Newsletter of July 18
Product Newsletter of May 18
Product Newsletter of March 18
Product Newsletter of February 18
Product Newsletter of January 18
Indusface Product Newsletter - March 2022
Indusface Product Newsletter - February 2023
Indusface Product Newsletter- October 2022
Zero Day Vulnerability Reports
Vulnerabilities Detected in 2023
Vulnerability Report of May 23
Vulnerability Report of March 23
Vulnerability Report of August 23
Vulnerability Report of July 23
Vulnerability Report of April 23
Vulnerability Report of November 23
Vulnerability Report of June 23
Vulnerability Report of December 23
Vulnerability Report of February 23
Vulnerability Report of January 23
Vulnerability Report of September 23
Vulnerability Report of October 23
Vulnerabilities Detected in 2016
CRS vs. Zero Day Vulnerability - December 2016
CRS vs. Zero Day Vulnerability - November 2016
CRS vs. Zero Day Vulnerability - October 2016
CRS vs Zero Day Vulnerability - September 2016
CRS Vs Zero Day Vulnerabilities - August 2016
Vulnerabilities Detected in 2017
Vulnerability Report of April 17
Vulnerability report for Apr 3rd - Apr 9th 17
Vulnerability report for April 17th - Apr 23rd 17
Vulnerability report of April 10th - April 16th
Vulnerability Report of March 17
Vulnerability report for Mar 20th - Mar 26th
Vulnerability report for Mar 13th - Mar 19th
Vulnerability report for 27th Feb - 5th Mar
Vulnerability report for Mar 27th - Apr 2nd
Vulnerability report for Mar 6th - Mar 12th
Vulnerability Report of February 17
Vulnerability Report of January 17
Vulnerability Report of December 17
Vulnerability Report of November 17
Vulnerability Report of August 17
Vulnerability Report of September 17
Vulnerability Report of October 17
Vulnerability Report of July 17
Vulnerability Report of June 17
Vulnerability Report of May 17
Vulnerabilities Detected in 2018
Vulnerability Report of December 18
Vulnerability Report of November 18
Vulnerability Report of October 18
Vulnerability Report of September 18
Vulnerability Report of August 18
Vulnerability Report of July 18
Vulnerability Report of June 18
Vulnerability Reports of May 18
Vulnerability Report of April 18
Vulnerability Report of March 18
Vulnerability Report of February 18
Vulnerability Report of January 18
Vulnerabilities Detected in 2019
Vulnerability Report of December 19
Vulnerability Report of November 19
Vulnerability Report of October 19
Vulnerability Report of September 19
Vulnerability Report of August 19
Vulnerability Report of July 19
Vulnerability Report of June 19
Vulnerability Report of May 19
Vulnerability Report of April 19
Vulnerability Report of March 19
Vulnerability Report of February 19
Vulnerability Report of January 19
vulnerabilities Detected in 2020
Vulnerability Report of December 20
Vulnerability Report of November 20
Vulnerability Report of October 20
Vulnerability Report of Sep 20
Vulnerability Report of July 20
Vulnerability Report of June 20
Vulnerability Report of May 20
Vulnerability Report of April 20
Vulnerability Report of March 20
Vulnerability Report of February 20
Vulnerability Report of January 20
Vulnerabilities Detected in 2021
Vulnerability Report of November 21
Vulnerability Report of October 21
Vulnerability Report of September 21
Vulnerability Report of August 21
Vulnerability Report of July 21
Vulnerability Report of June 21
Vulnerability Report of May 21
Vulnerability Report of April 21
Vulnerability Report of March 21
Vulnerability Report of February 21
Vulnerability Report of January 21
Vulnerability Report of December 21
Vulnerabilities Detected in 2022
Vulnerability Report of January 22
Vulnerability Report of February 22
Vulnerability Report of March 22
Vulnerability Report of April 22
Vulnerability Report of May 22
Vulnerability Report of June 22
Vulnerability Report of July 22
Vulnerability Report of August 22
Vulnerability Report of September 22
Vulnerability Report of October 22
Vulnerability Report of November 22
Zero-Day Vulnerability Report - December 2022
Vulnerabilities Detected in 2024
Security Bulletin
Vulnerabilities 2024
Critical Apache OFBiz Zero-day AuthBiz (CVE-2023-49070 and CVE-2023-51467)
ScreenConnect Authentication Bypass (CVE-2024-1709 & CVE-2024-1708)
CVE-2024-1071 – Critical Vulnerability in Ultimate Member WordPress Plugin
Oracle WebLogic Server Deserialization
ApacheStructs_VG
Apache Struts 2 Vulnerability CVE-2023-50164 Exposed
Unpacking the Zimbra Cross-Site Scripting Vulnerability(CVE-2023-37580)
Adobe ColdFusion Vulnerabilities Exploited in the Wild
Remote Unauthenticated API Access Vulnerabilities in Ivanti
Multiple Moveit Transfer Vulnerabilities
HTTP/2 Rapid Reset Attack Vulnerability
Apache log4j RCE vulnerability
Table of Contents
- All Categories
- AppTrana
- Product User Guide
- Overview
Overview

A brief introduction to Indusface AppTrana.
A well-designed system that supports AppTrana customers to understand the security status of websites. Overview page consists of all groups, websites, and their details like Vulnerability summary, Attack summary, Traffic summary, and so on.
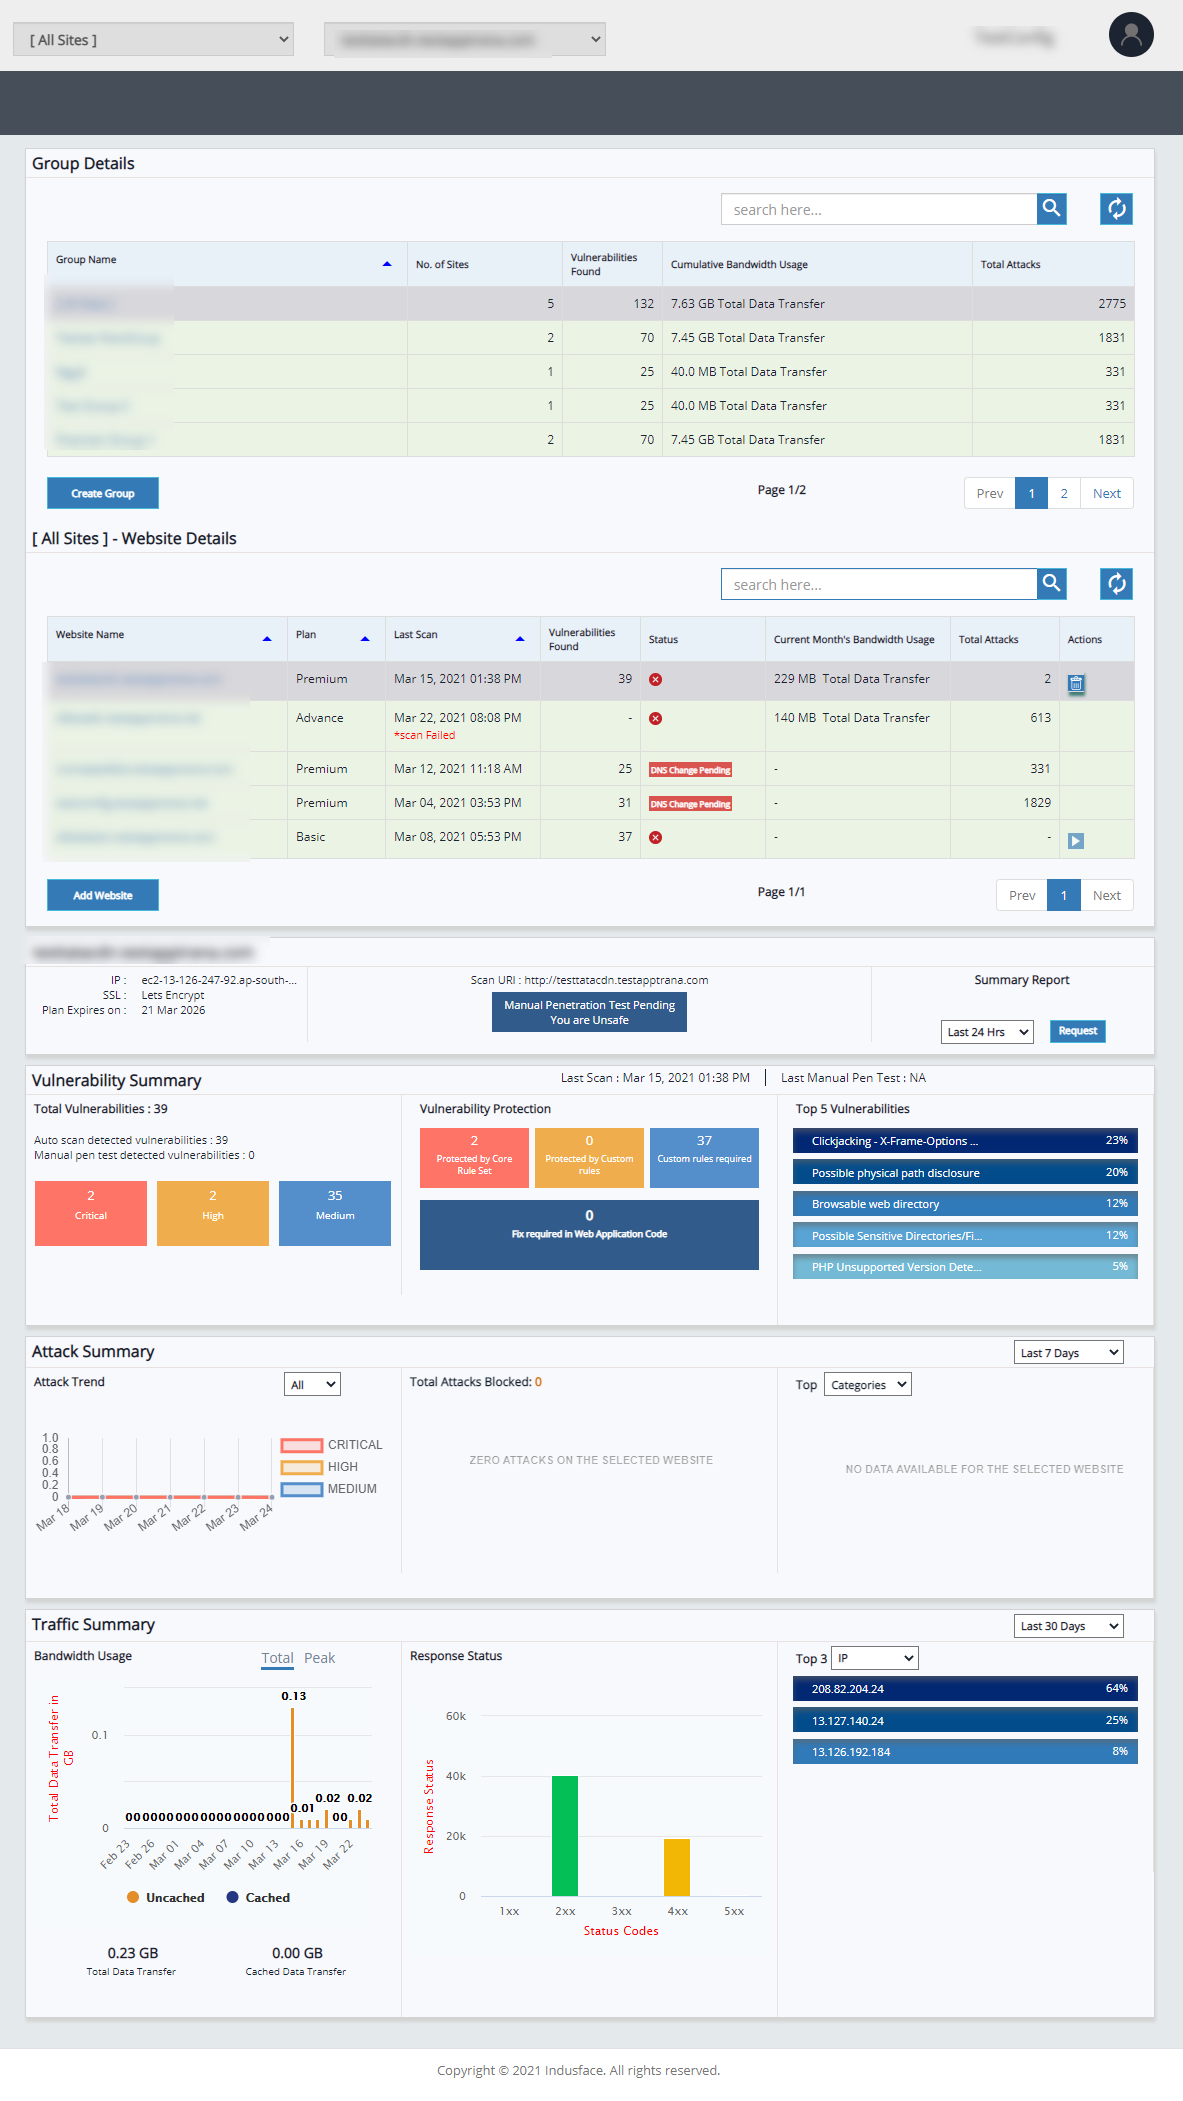
Group Details
- The Group Details table discusses the list of groups, the number of sites associated with the group, cumulative bandwidth usage, total attacks, vulnerabilities found, and how to create a group, and so on. Customers can check the progress of vulnerabilities and all details within the group.
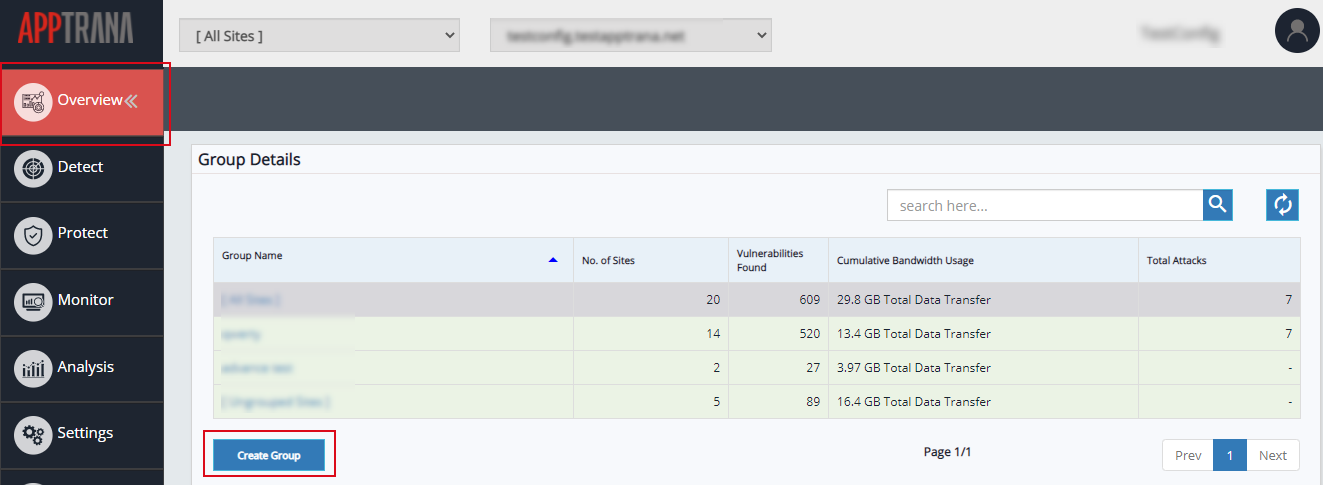
- To create a new group, click Create Group and for more information visit Manage page.
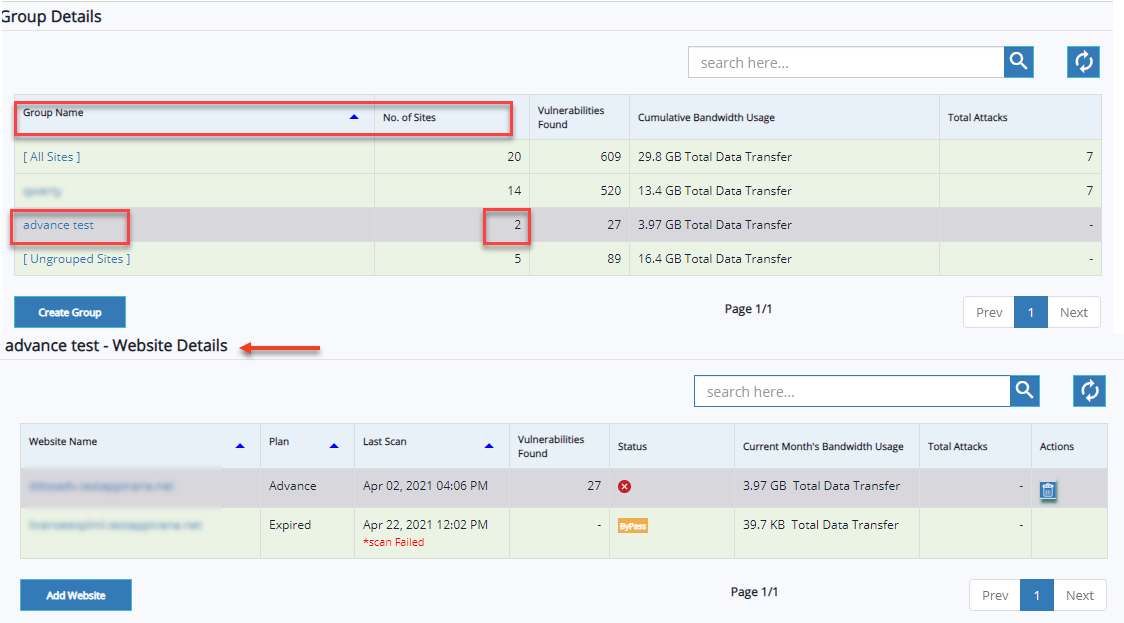
- Select Group name to view details of selected group and websites within the group.
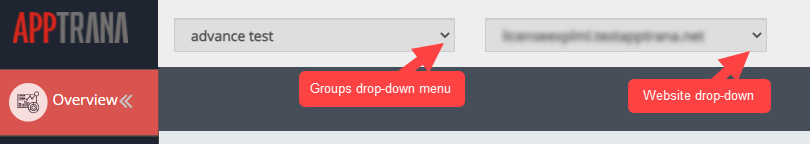
Choose the following options to view summary details of a specific website:
- Click Groups drop-down list and select a group in which website has been added. Click websites drop-down menu and select desired website to view the attack summary of that website.
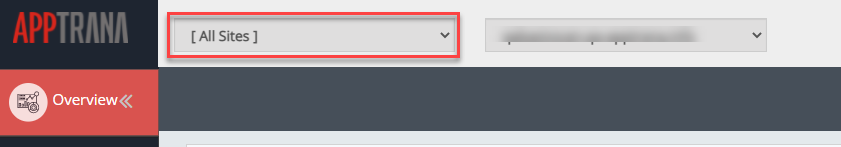
All sites group is selected by default. This group consists of total websites. customers can see the details of all websites within the group.
- Search bar is given in website details and group details. Search bar icon helps to retrieve the website details quickly from list.
Search Group: Click Search here text-bar, enter group name, and click search button. Group data will be displayed in the table.
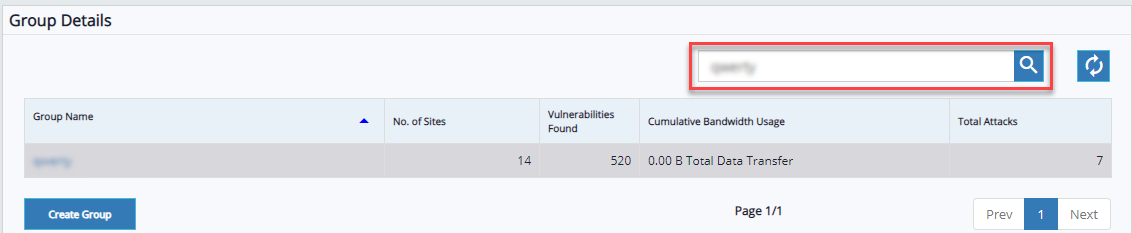
Click refresh to clear the selection.
Search Website: Click Search here text-bar, enter plan name or website name, and click search icon.
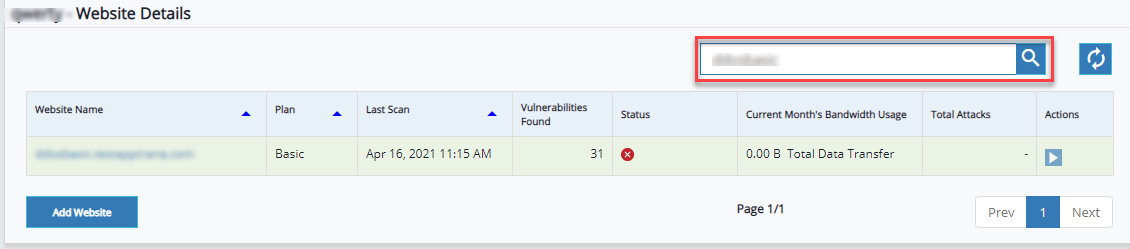
Website data will be displayed in the table.
Click refresh to clear the selection.
Add Website
Click Add Website button to add a new website. Click here for more information.
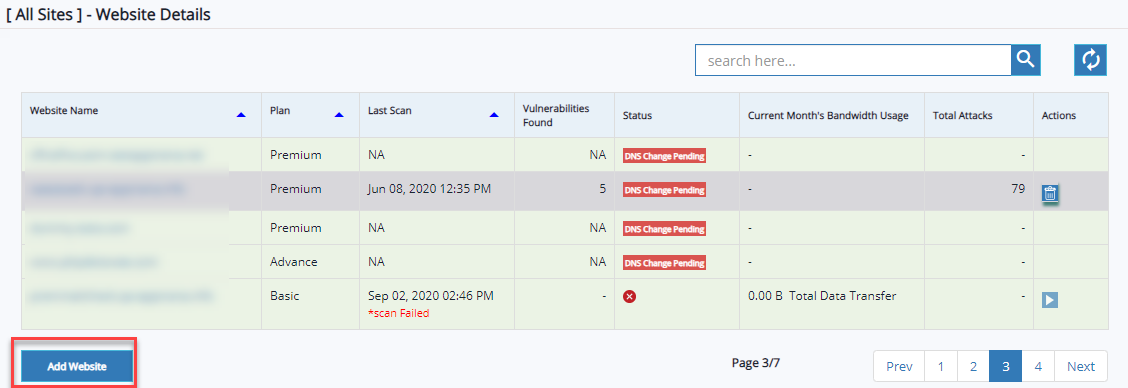
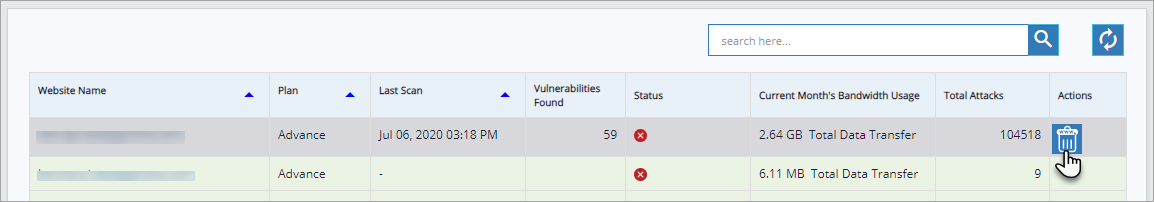
Delete Website
Click Website Name to enable Delete button and click Delete button. Confirmation pop-up appears.
A confirmation pop-up will appear with the following message:
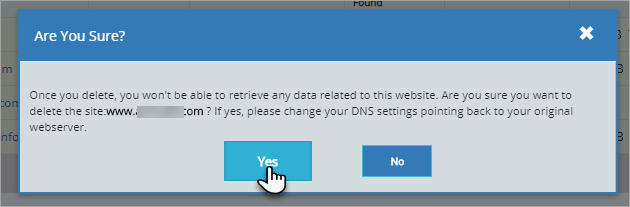
Read the information carefully and Click Yes button to delete the website and click No button to cancel the action.
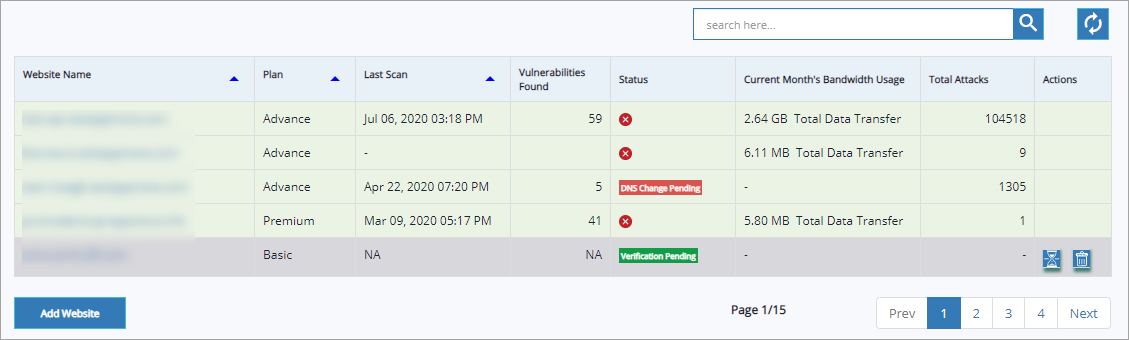
Application Details
In application details table Website Name, Plan, Last Scan, Vulnerabilities Found, and so on other details are displayed.
Parameter | Description |
Website name | Website URL(s) registered is/are displayed in this column. |
Plan | As different websites can opt for different plans, the specific plan followed by a website is displayed in this column. |
Last Scan | Latest updated scan date & time of a specific website is displayed in this column. |
Vulnerabilities Found | Total number of vulnerabilities found is displayed in this column. NA(Not Applicable) is displayed for websites with verification pending, DNS change pending etc., which means scan cannot be performed to find vulnerabilities in an application. |
Status | Protection or security status of a website is displayed in the form of an icon, for example: severity level of vulnerabilities which needs protection. Cursor over an icon to display the website status. DNS change pending, Verification pending, Manual PT pending etc., website status is displayed in this column. |
Current Month's Bandwidth Usage | This column displays the total data transfer of a specific website. |
Total Attacks | Latest updated total attack count is displayed in this column. |
Actions | Subscription, Verification, Deletion actions are performed in this column. Make sure the website row is selected to performed any action. |
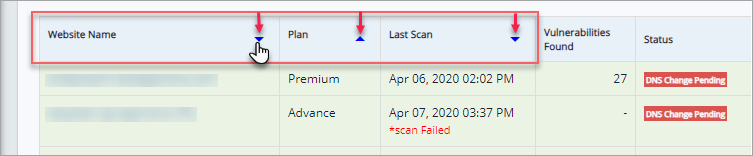
Click upwards or downwards arrow of Website Name to display the latest updated websites. This option is available for Plan and Last Scan also. Click on the arrow to display latest information and vice-versa.
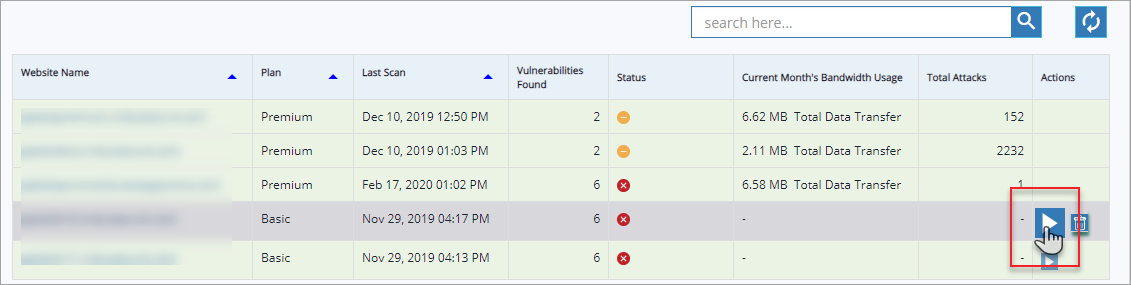
A user can subscribe to a paid plan from Overview page itself.
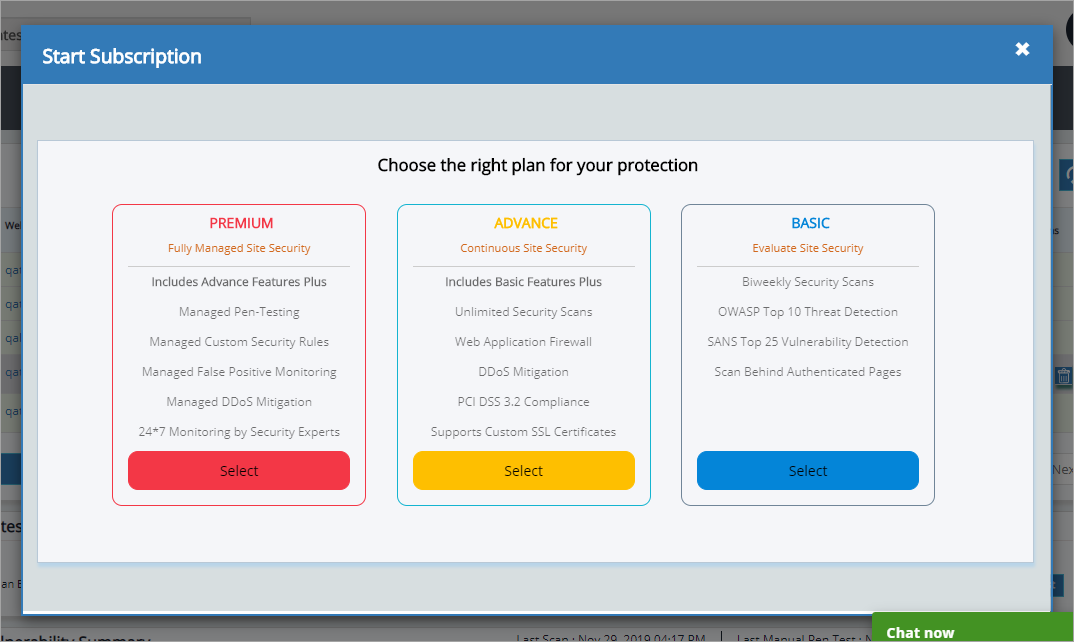
Click to select a specific URL and click subscribe icon. Start Subscription page appears.
Click Select button of Premium plan or Advance plan to upgrade your plan from basic. For further details, click here for change plan document.
Specified Website information such as IP address, SSL certificate, plan expiry date, URL, Manual Pen Test status etc., is displayed below website details table.
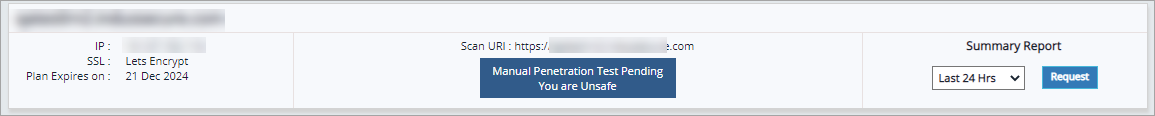
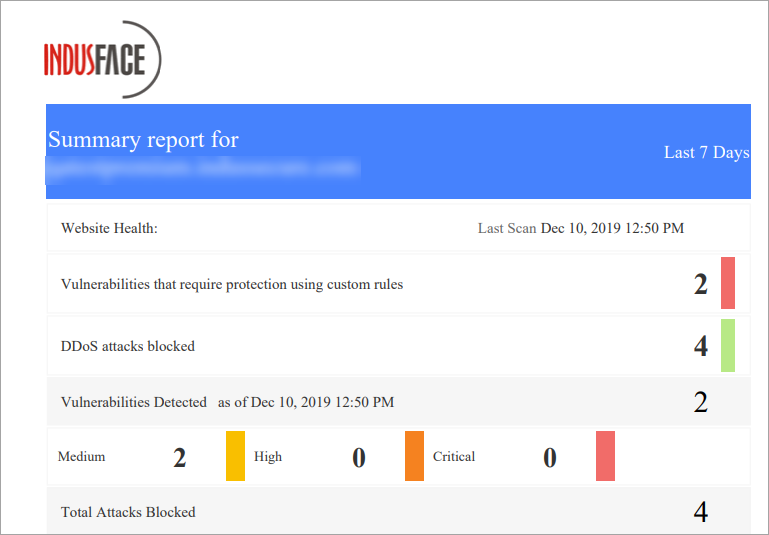
Click Summary Report drop down, click one of the following options and then click Request. PDF report is displayed.
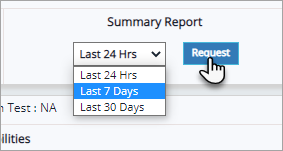
This report has detailed summary of attacks and vulnerabilities found for selected time period. Depends on the attack information found, the report size may vary. For example, no. of attacks blocked, vulnerability details etc.
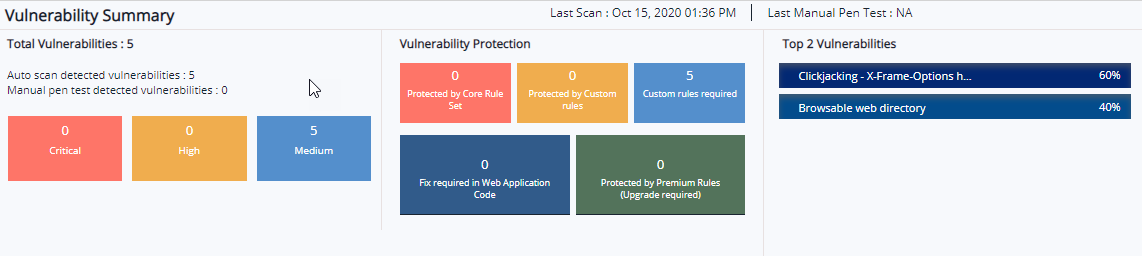
Vulnerability Summary
Total number of vulnerabilities among which are auto scan and manual pen test vulnerabilities with severity categories like Critical, High, and Medium. Vulnerability Protection displays if a vulnerability is protected by Core Rule Set or Custom Rules, custom rules required for better protection and if any fix required in Web Application Code. Top 5 vulnerabilities displays vulnerability name with percentage in descending order.
Attack Summary
This summary category collectively displays Attack Trend, Attacks Blocked, Top 5 Attack Categories, URI, Countries(as per the selection). All these attack trendlines has 3 data timeline options to select from i.e., Last 24 hrs., Last 7 days, and Last 30 days.
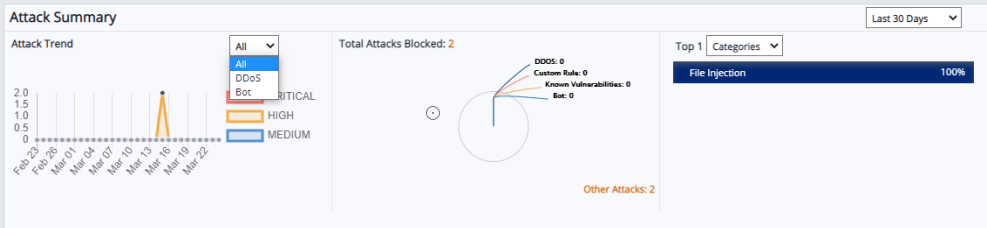
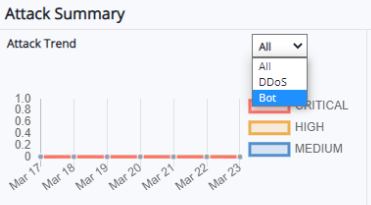
Attack Trend:
This is a linear trendline capturing all the attack data, DDos attack data, and Bot attack data which is categorized into critical, high, and medium severity level. Data is displayed for last 7 days, last 24 hrs, and last 30 days data can be selected from the drop-down.
To view the graph for specific severity level like critical or high for example, click critical and medium options to strike them off and view only high vulnerability attacks for 30 days or 7 days or 24 hrs.
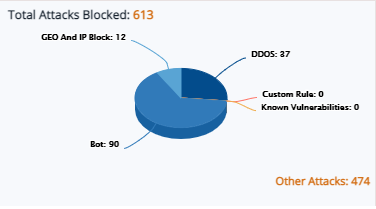
Total Attacks Blocked:
The pie chart displays the total attacks blocked. These blocked attacks are categorized into DDoS, Blocked by Custom rule, attacks on known vulnerabilities, Geo and IP block. The attacks blocked other than these category displays as other attacks. The data of blocked attacks will display in number as well as in percentage.
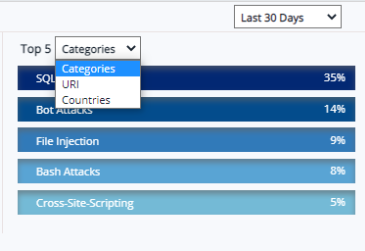
Top 5 Attack Categories/URI/Countries:
By default, Categories option is selected. Click Top 5 Categories drop-down and select URI or Countries to display the attacks data in descending order.
Traffic Summary
The Bandwidth Usage graph represents both Cached and Uncached data with details Total Data Transfer in GB and specific days.
Response Status covers 5 top status codes 1xx, 2xx, 3xx, 4xx, and 5xx to the count of response status. Both the graphs can be displayed results from past 24 hours, 7 days, and 30 days.
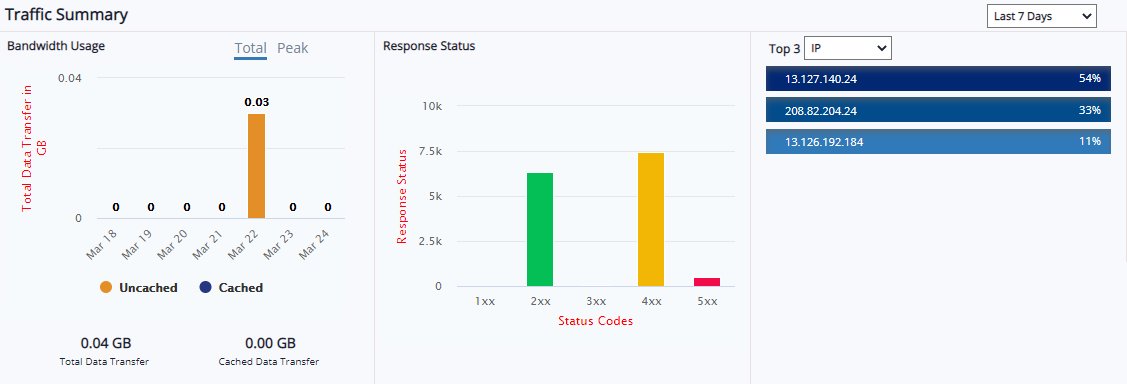
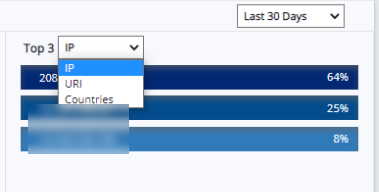
Top IP addresses, URIs, and Countries are displayed as percentages in descending order. This percentage is displayed for 24 hours, 7 days, and 30 days.