AppTrana
Getting Started
Frequently Asked Questions
Product Details
API Scan Coverage for OWASP Top 10
Whitelist Vulnerabilities on the AppTrana WAAP
API Request to Purge CDN Data
Analysis page - Attack Trend Visualisation
Advanced Behavioral DDoS
BOT Protection
Asset Discovery
Customize Application Behavior with Bot Score
Restricted Admin User
Self Service Rules
Configuring Custom Error Page in AppTrana
Enabling SIEM Integration
API Discovery Feature
SwyftComply
Analysis page - Access Trend Visualization
Manage WAAP Email Alerts
Enable and Configure Single Sign-On
WAF Automated Bypass and Unbypass
False Positive Analysis Report on WAAP
Product User Guide
Indusface WAS
Getting Started
Product User Guide
Summary
Dashboard
Malware Monitoring[MM]
Application Audit[AA]
Vulnerability Assessment[VA]
Reports
Settings
Asset Monitoring
New Reporting Structure
Frequently Asked Questions
Feature Summary
AcuRisQ – Risk Management with Advanced Risk Scoring
WAS Consulting License
API Key Based - Scan Log Export
WAS Defacement Checks
SIEM Integration with Sumo Logic
Indusface WAS Scanned Vulnerabilities
Total Application Security
Onboarding Documents
Indusface Newsletter
Indusface Product Newsletter - October 2021
Indusface Product Newsletter- April 2021
Indusface Product Newsletter-January21
Indusface Product Newsletter - June 20
Indusface Product Newsletter - October 19
Indusface Product Newsletter - August 19
Product Newsletter of May 19
Product Newsletter of March 19
Product Newsletter of January 19
WAF Portal Revamp June 18
Product Newsletter of July 18
Product Newsletter of May 18
Product Newsletter of March 18
Product Newsletter of February 18
Product Newsletter of January 18
Indusface Product Newsletter - March 2022
Indusface Product Newsletter - February 2023
Indusface Product Newsletter- October 2022
Zero Day Vulnerability Reports
Vulnerabilities Detected in 2023
Vulnerability Report of May 23
Vulnerability Report of March 23
Vulnerability Report of August 23
Vulnerability Report of July 23
Vulnerability Report of April 23
Vulnerability Report of November 23
Vulnerability Report of June 23
Vulnerability Report of December 23
Vulnerability Report of February 23
Vulnerability Report of January 23
Vulnerability Report of September 23
Vulnerability Report of October 23
Vulnerabilities Detected in 2016
CRS vs. Zero Day Vulnerability - December 2016
CRS vs. Zero Day Vulnerability - November 2016
CRS vs. Zero Day Vulnerability - October 2016
CRS vs Zero Day Vulnerability - September 2016
CRS Vs Zero Day Vulnerabilities - August 2016
Vulnerabilities Detected in 2017
Vulnerability Report of April 17
Vulnerability report for Apr 3rd - Apr 9th 17
Vulnerability report for April 17th - Apr 23rd 17
Vulnerability report of April 10th - April 16th
Vulnerability Report of March 17
Vulnerability report for Mar 20th - Mar 26th
Vulnerability report for Mar 13th - Mar 19th
Vulnerability report for 27th Feb - 5th Mar
Vulnerability report for Mar 27th - Apr 2nd
Vulnerability report for Mar 6th - Mar 12th
Vulnerability Report of February 17
Vulnerability Report of January 17
Vulnerability Report of December 17
Vulnerability Report of November 17
Vulnerability Report of August 17
Vulnerability Report of September 17
Vulnerability Report of October 17
Vulnerability Report of July 17
Vulnerability Report of June 17
Vulnerability Report of May 17
Vulnerabilities Detected in 2018
Vulnerability Report of December 18
Vulnerability Report of November 18
Vulnerability Report of October 18
Vulnerability Report of September 18
Vulnerability Report of August 18
Vulnerability Report of July 18
Vulnerability Report of June 18
Vulnerability Reports of May 18
Vulnerability Report of April 18
Vulnerability Report of March 18
Vulnerability Report of February 18
Vulnerability Report of January 18
Vulnerabilities Detected in 2019
Vulnerability Report of December 19
Vulnerability Report of November 19
Vulnerability Report of October 19
Vulnerability Report of September 19
Vulnerability Report of August 19
Vulnerability Report of July 19
Vulnerability Report of June 19
Vulnerability Report of May 19
Vulnerability Report of April 19
Vulnerability Report of March 19
Vulnerability Report of February 19
Vulnerability Report of January 19
vulnerabilities Detected in 2020
Vulnerability Report of December 20
Vulnerability Report of November 20
Vulnerability Report of October 20
Vulnerability Report of Sep 20
Vulnerability Report of July 20
Vulnerability Report of June 20
Vulnerability Report of May 20
Vulnerability Report of April 20
Vulnerability Report of March 20
Vulnerability Report of February 20
Vulnerability Report of January 20
Vulnerabilities Detected in 2021
Vulnerability Report of November 21
Vulnerability Report of October 21
Vulnerability Report of September 21
Vulnerability Report of August 21
Vulnerability Report of July 21
Vulnerability Report of June 21
Vulnerability Report of May 21
Vulnerability Report of April 21
Vulnerability Report of March 21
Vulnerability Report of February 21
Vulnerability Report of January 21
Vulnerability Report of December 21
Vulnerabilities Detected in 2022
Vulnerability Report of January 22
Vulnerability Report of February 22
Vulnerability Report of March 22
Vulnerability Report of April 22
Vulnerability Report of May 22
Vulnerability Report of June 22
Vulnerability Report of July 22
Vulnerability Report of August 22
Vulnerability Report of September 22
Vulnerability Report of October 22
Vulnerability Report of November 22
Zero-Day Vulnerability Report - December 2022
Vulnerabilities Detected in 2024
Security Bulletin
Vulnerabilities 2024
Critical Apache OFBiz Zero-day AuthBiz (CVE-2023-49070 and CVE-2023-51467)
ScreenConnect Authentication Bypass (CVE-2024-1709 & CVE-2024-1708)
CVE-2024-1071 – Critical Vulnerability in Ultimate Member WordPress Plugin
Oracle WebLogic Server Deserialization
ApacheStructs_VG
Apache Struts 2 Vulnerability CVE-2023-50164 Exposed
Unpacking the Zimbra Cross-Site Scripting Vulnerability(CVE-2023-37580)
Adobe ColdFusion Vulnerabilities Exploited in the Wild
Remote Unauthenticated API Access Vulnerabilities in Ivanti
Multiple Moveit Transfer Vulnerabilities
HTTP/2 Rapid Reset Attack Vulnerability
Apache log4j RCE vulnerability
Table of Contents
Monitor

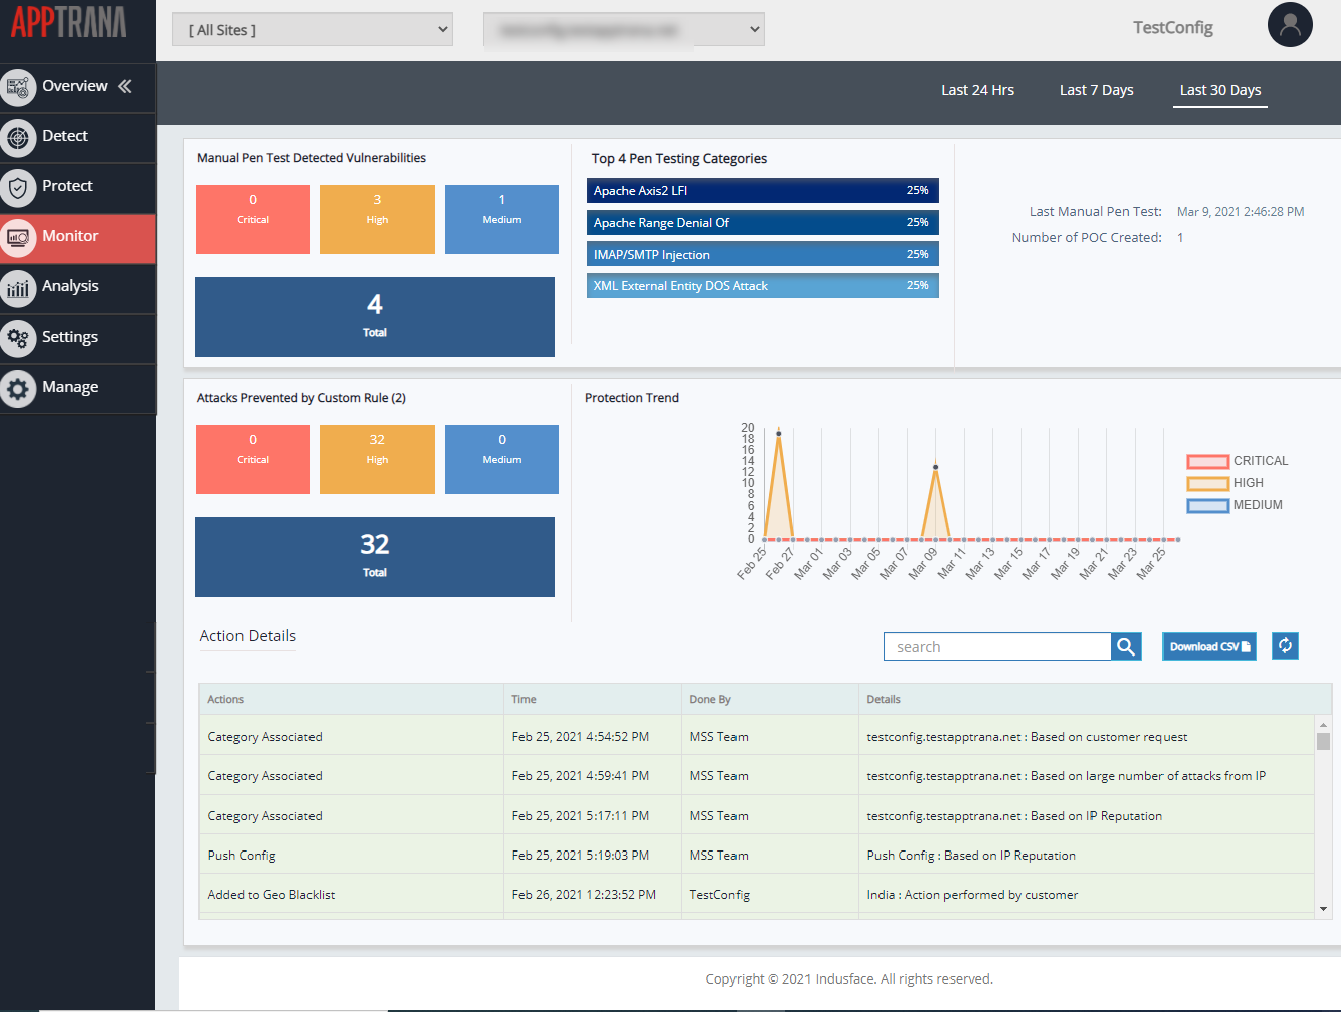
This page displays Manual Pen Testing detected vulnerabilities, Custom Rules protected vulnerabilities, Top 5 Manual Pen Testing categories, Number of POC(Proof of Concept) created, Number of Custom Rules created, and so on. The detected attacks are categorized into Critical, High, and Medium as per the severity level.
Further details of attacks are displayed in Attack Details table.
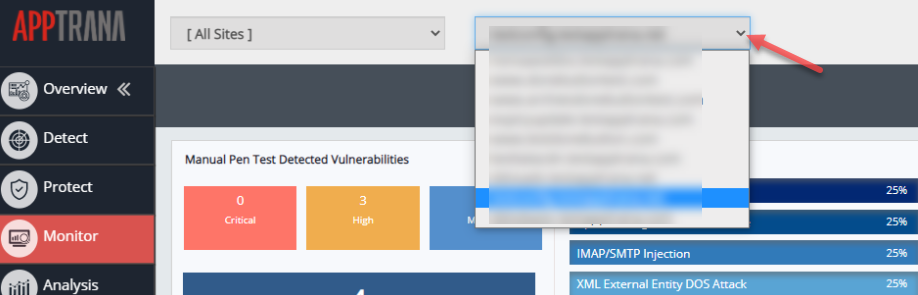
Click website filter drop-down and click to select a specific website. The Security Summary of the website is displayed.
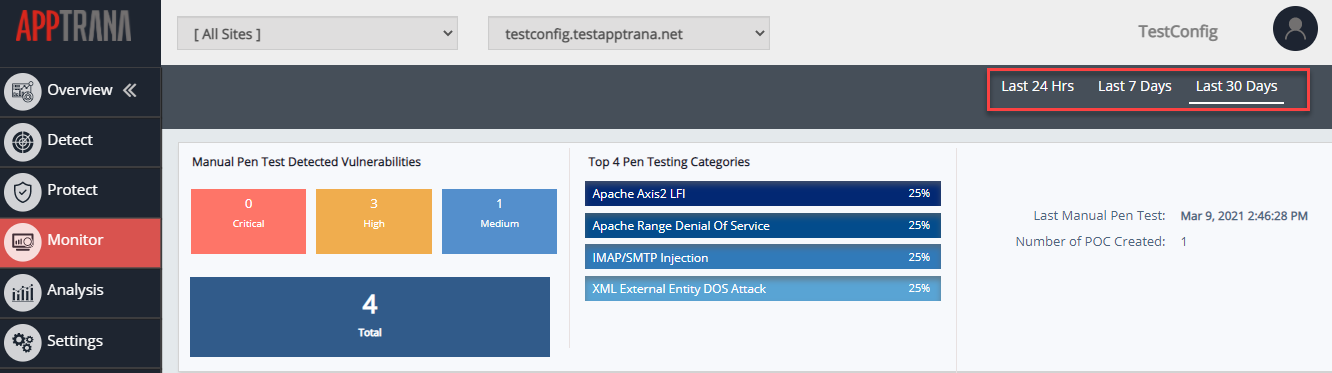
The detected vulnerabilities are categorized into 3 time spans i.e., Last 24 hrs, Last 7 days, and Last 30 days. By selecting one of the above options, vulnerabilities found during the selected time period are only displayed.
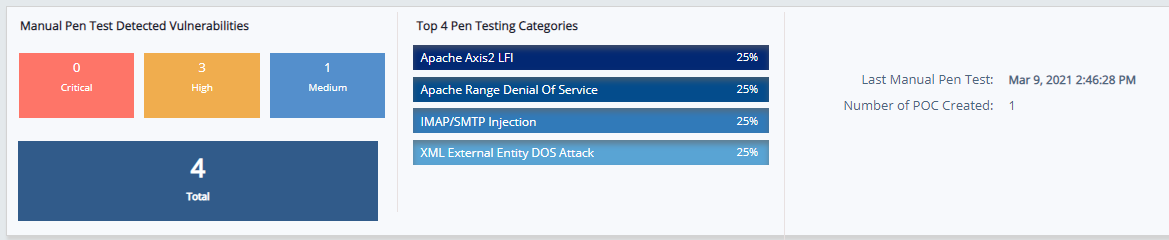
Manual Pen Test details
Manual Pen Test Detected Vulnerabilities are categorized into Critical, High, and Medium as per the severity of attacks. Total vulnerability count is also displayed.
Pen Testing categories detected frequently are categorised into Top 5 Pen Testing Categories by picking top 5 among the total.
The date and time of the last Manual Pen Test is displayed, number of POC created is displayed displayed.
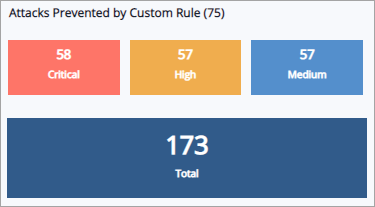
Attacks Prevented by Custom Rule
The number of attacks prevented by the custom rules requested by the user. These attacks are classified into critical, high, medium, and total number is displayed below. The count of Custom Rules created is displayed.
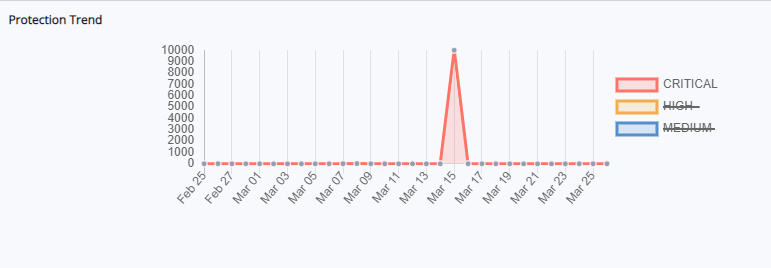
Protection Trend
This graph display attacks discovered in a linear chart with highs and lows as per the attacks found in selected time period. Attacks are classified into critical, high and medium as per the attack's severity level.
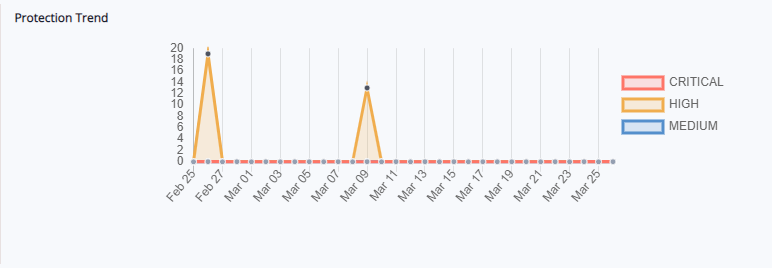
Protection trend can be displayed for last 30 days and for last 24 hours as per the selection. To view a specific severity level, disable the rest of the options.
Click high and medium in order to disable and only critical vulnerability graph is displayed.
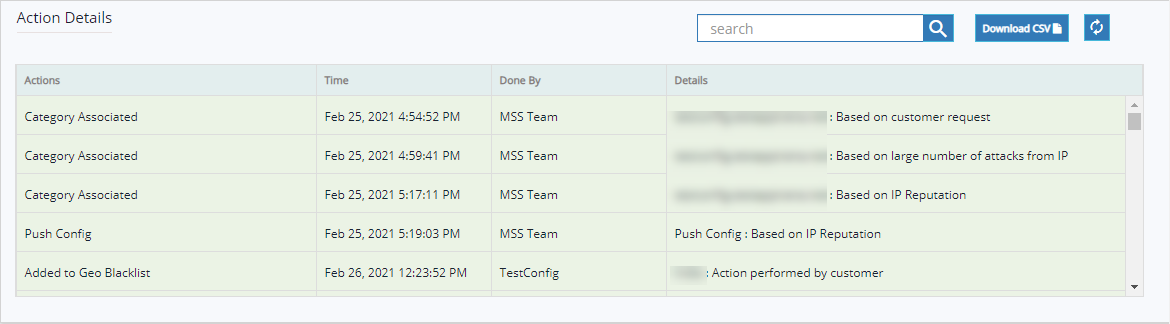
Action Details
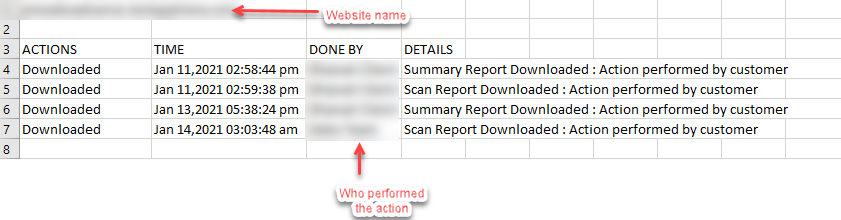
This table displays the action details performed by the user, Indusface MSS team, and user requests for specific changes.
Details displayed in the table are name of the action that has been performed, time of the action, performed by whom, and further details of the action.
Enter a specific action item in the search bar to find all the similar type and click refresh button to undo the action.
Download CSV
This feature enables AppTrana customers to download all action details like Website name, who performed the action, time of action, and further details in CSV format.
How does it work?
- Select Monitor tab on the left pane.
- Go to Action Details section and there you can find the Download CSV button.

- Click Download CSV button to get the action details in CSV format.
- The CSV file gives the action details of a particular website and that looks like this: