AppTrana
Getting Started
Frequently Asked Questions
Product Details
API Scan Coverage for OWASP Top 10
Whitelist Vulnerabilities on the AppTrana WAAP
API Request to Purge CDN Data
Analysis page - Attack Trend Visualisation
Advanced Behavioral DDoS
BOT Protection
Asset Discovery
Customize Application Behavior with Bot Score
Restricted Admin User
Self Service Rules
Configuring Custom Error Page in AppTrana
Enabling SIEM Integration
API Discovery Feature
SwyftComply
Analysis page - Access Trend Visualization
Manage WAAP Email Alerts
Enable and Configure Single Sign-On
WAF Automated Bypass and Unbypass
False Positive Analysis Report on WAAP
Product User Guide
Indusface WAS
Getting Started
Product User Guide
Summary
Dashboard
Malware Monitoring[MM]
Application Audit[AA]
Vulnerability Assessment[VA]
Reports
Settings
Asset Monitoring
New Reporting Structure
Frequently Asked Questions
Feature Summary
AcuRisQ – Risk Management with Advanced Risk Scoring
WAS Consulting License
API Key Based - Scan Log Export
WAS Defacement Checks
SIEM Integration with Sumo Logic
Indusface WAS Scanned Vulnerabilities
Total Application Security
Onboarding Documents
Indusface Newsletter
Indusface Product Newsletter - October 2021
Indusface Product Newsletter- April 2021
Indusface Product Newsletter-January21
Indusface Product Newsletter - June 20
Indusface Product Newsletter - October 19
Indusface Product Newsletter - August 19
Product Newsletter of May 19
Product Newsletter of March 19
Product Newsletter of January 19
WAF Portal Revamp June 18
Product Newsletter of July 18
Product Newsletter of May 18
Product Newsletter of March 18
Product Newsletter of February 18
Product Newsletter of January 18
Indusface Product Newsletter - March 2022
Indusface Product Newsletter - February 2023
Indusface Product Newsletter- October 2022
Zero Day Vulnerability Reports
Vulnerabilities Detected in 2023
Vulnerability Report of May 23
Vulnerability Report of March 23
Vulnerability Report of August 23
Vulnerability Report of July 23
Vulnerability Report of April 23
Vulnerability Report of November 23
Vulnerability Report of June 23
Vulnerability Report of December 23
Vulnerability Report of February 23
Vulnerability Report of January 23
Vulnerability Report of September 23
Vulnerability Report of October 23
Vulnerabilities Detected in 2016
CRS vs. Zero Day Vulnerability - December 2016
CRS vs. Zero Day Vulnerability - November 2016
CRS vs. Zero Day Vulnerability - October 2016
CRS vs Zero Day Vulnerability - September 2016
CRS Vs Zero Day Vulnerabilities - August 2016
Vulnerabilities Detected in 2017
Vulnerability Report of April 17
Vulnerability report for Apr 3rd - Apr 9th 17
Vulnerability report for April 17th - Apr 23rd 17
Vulnerability report of April 10th - April 16th
Vulnerability Report of March 17
Vulnerability report for Mar 20th - Mar 26th
Vulnerability report for Mar 13th - Mar 19th
Vulnerability report for 27th Feb - 5th Mar
Vulnerability report for Mar 27th - Apr 2nd
Vulnerability report for Mar 6th - Mar 12th
Vulnerability Report of February 17
Vulnerability Report of January 17
Vulnerability Report of December 17
Vulnerability Report of November 17
Vulnerability Report of August 17
Vulnerability Report of September 17
Vulnerability Report of October 17
Vulnerability Report of July 17
Vulnerability Report of June 17
Vulnerability Report of May 17
Vulnerabilities Detected in 2018
Vulnerability Report of December 18
Vulnerability Report of November 18
Vulnerability Report of October 18
Vulnerability Report of September 18
Vulnerability Report of August 18
Vulnerability Report of July 18
Vulnerability Report of June 18
Vulnerability Reports of May 18
Vulnerability Report of April 18
Vulnerability Report of March 18
Vulnerability Report of February 18
Vulnerability Report of January 18
Vulnerabilities Detected in 2019
Vulnerability Report of December 19
Vulnerability Report of November 19
Vulnerability Report of October 19
Vulnerability Report of September 19
Vulnerability Report of August 19
Vulnerability Report of July 19
Vulnerability Report of June 19
Vulnerability Report of May 19
Vulnerability Report of April 19
Vulnerability Report of March 19
Vulnerability Report of February 19
Vulnerability Report of January 19
vulnerabilities Detected in 2020
Vulnerability Report of December 20
Vulnerability Report of November 20
Vulnerability Report of October 20
Vulnerability Report of Sep 20
Vulnerability Report of July 20
Vulnerability Report of June 20
Vulnerability Report of May 20
Vulnerability Report of April 20
Vulnerability Report of March 20
Vulnerability Report of February 20
Vulnerability Report of January 20
Vulnerabilities Detected in 2021
Vulnerability Report of November 21
Vulnerability Report of October 21
Vulnerability Report of September 21
Vulnerability Report of August 21
Vulnerability Report of July 21
Vulnerability Report of June 21
Vulnerability Report of May 21
Vulnerability Report of April 21
Vulnerability Report of March 21
Vulnerability Report of February 21
Vulnerability Report of January 21
Vulnerability Report of December 21
Vulnerabilities Detected in 2022
Vulnerability Report of January 22
Vulnerability Report of February 22
Vulnerability Report of March 22
Vulnerability Report of April 22
Vulnerability Report of May 22
Vulnerability Report of June 22
Vulnerability Report of July 22
Vulnerability Report of August 22
Vulnerability Report of September 22
Vulnerability Report of October 22
Vulnerability Report of November 22
Zero-Day Vulnerability Report - December 2022
Vulnerabilities Detected in 2024
Security Bulletin
Vulnerabilities 2024
Critical Apache OFBiz Zero-day AuthBiz (CVE-2023-49070 and CVE-2023-51467)
ScreenConnect Authentication Bypass (CVE-2024-1709 & CVE-2024-1708)
CVE-2024-1071 – Critical Vulnerability in Ultimate Member WordPress Plugin
Oracle WebLogic Server Deserialization
ApacheStructs_VG
Apache Struts 2 Vulnerability CVE-2023-50164 Exposed
Unpacking the Zimbra Cross-Site Scripting Vulnerability(CVE-2023-37580)
Adobe ColdFusion Vulnerabilities Exploited in the Wild
Remote Unauthenticated API Access Vulnerabilities in Ivanti
Multiple Moveit Transfer Vulnerabilities
HTTP/2 Rapid Reset Attack Vulnerability
Apache log4j RCE vulnerability
Table of Contents
- All Categories
- Indusface WAS
- Product User Guide
- Malware Monitoring[MM]
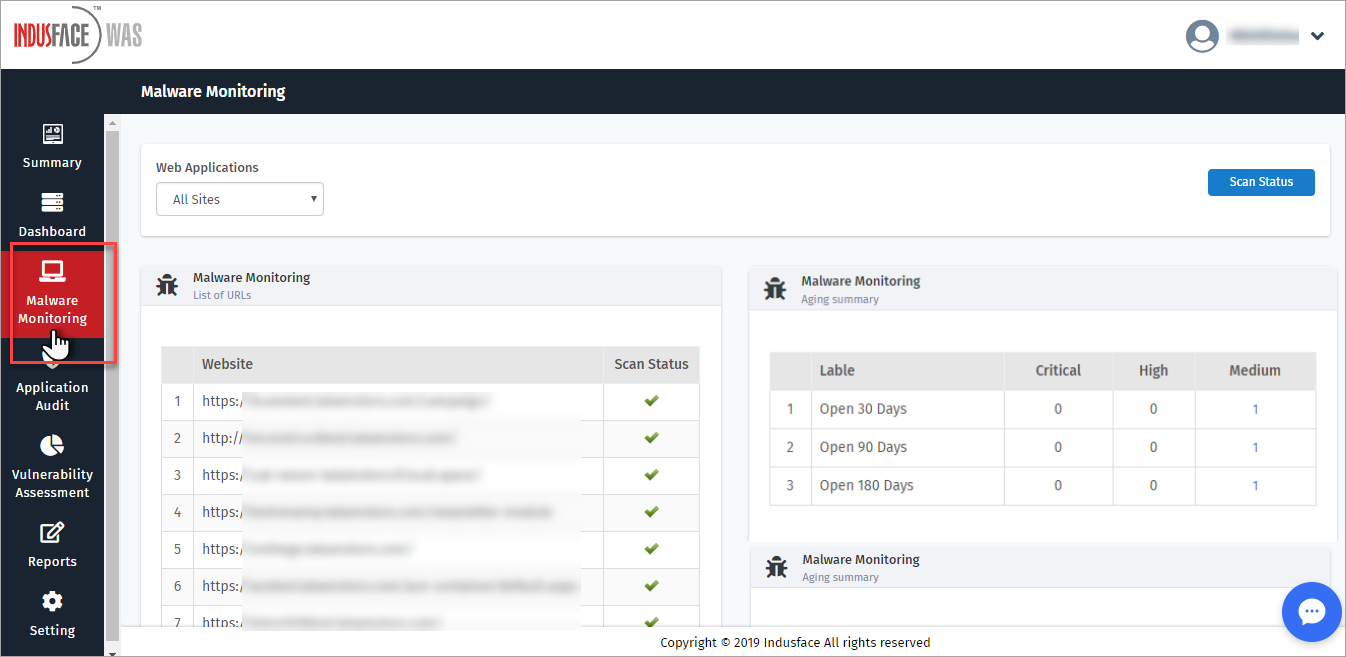
Malware Monitoring[MM]

This tab displays the details of Malware Monitoring(MM) scans in the form of widgets. Some of the data displayed is Threats Identified during last 5 Days, List of URLs etc.
Click Malware Monitoring[MM] tab on the left navigation plane to display only MM scan reports.
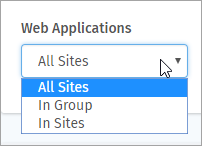
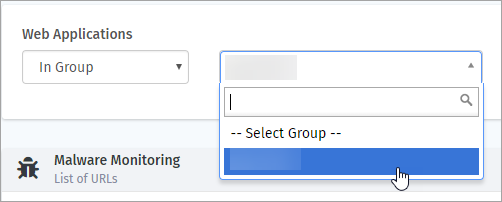
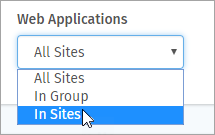
Web Applications
By default, All Sites option is selected by opening MM page. In Group(s) or In Site(s) options to display only a specific group or a website from the existing.
In Group
Click In Group(s) option from Web Applications drop-down. Select Group drop-down appears.
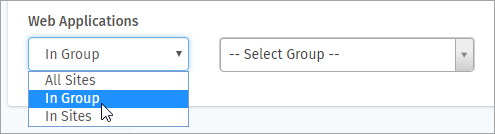
Click Select Group drop-down and click any group. The scan summary details of the group are displayed.
If the selected group is not subscribed for Malware Monitoring service, Dashboard page appears.
[OR]
The list of URLs included in the group are displayed on the top along with the various scan reports like Top Threats Identified During Last 5 Days, Threats Identified During Last Scan etc.
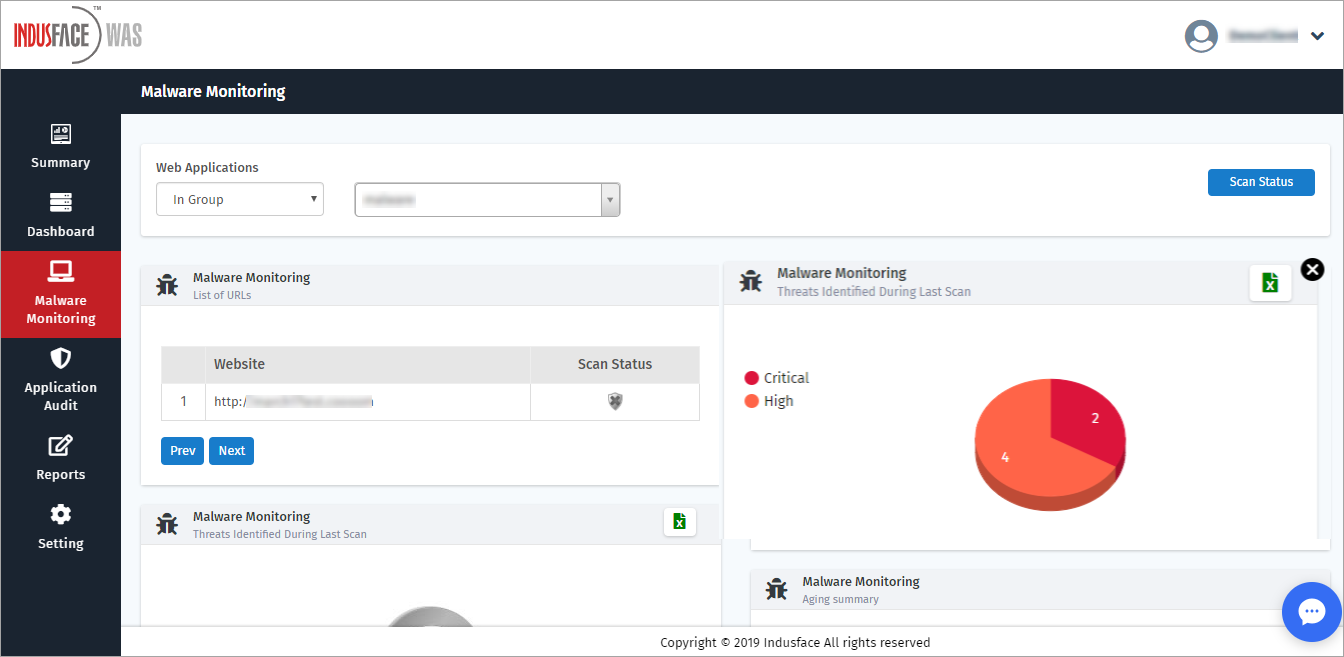
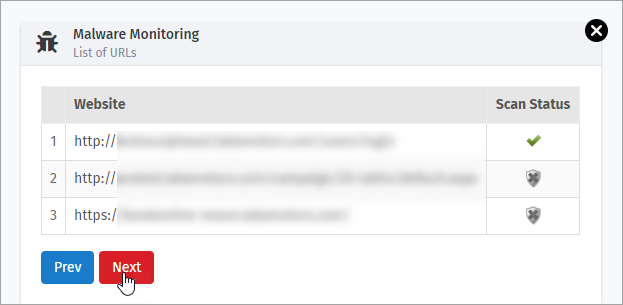
List of URLs
This widget displays the Website URLs registered for Malware Monitoring scan and their Scan Status.
Scan Status is displayed  , if your Malware Monitoring(MM) has passed last Indusface WAS Security Scan. It does not have any critical alert.
Scan Status is displayed  , if Indusface WAS security scan is running or not yet started your MM service.
Scan Status is displayed  , if there is one or more critical alert found in last MM scan.
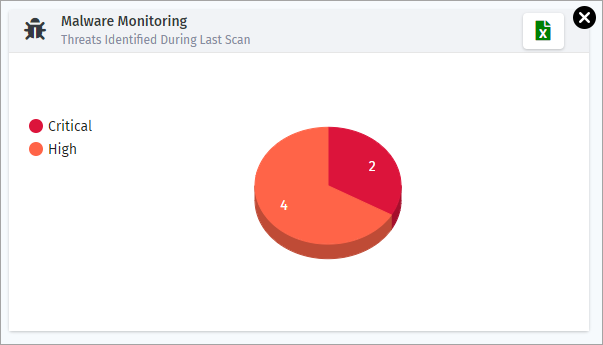
Threats Identified During Last Scan
This widget displays the threats found in last scan as Critical, High, Medium, and Low according to severity in the form of a pie chart. In this example, only High and Low vulnerabilities are discovered as shown.
Click  to download the report in CSV format.
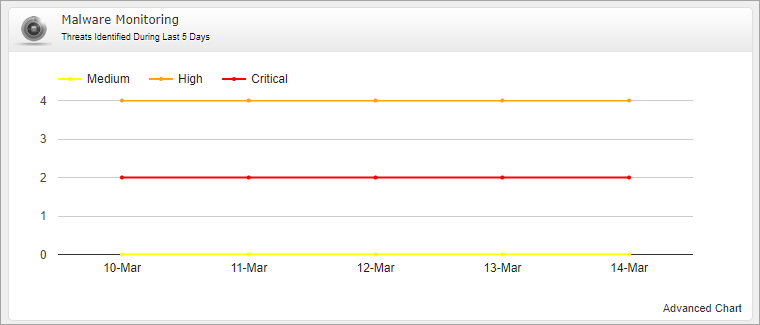
Threats Identified During Last 5 Days
This widget displays information in linear graph format with dates on x-axis and range on y-axis. In this example, Critical and High vulnerabilities are found.
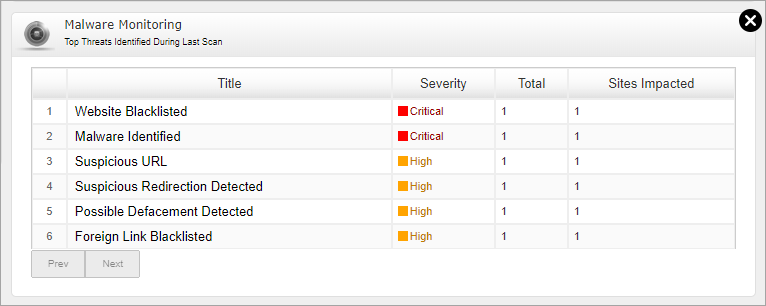
Top Threats Identified During Last Scan
This widget displays the list of vulnerabilities detected during last MM scan with title, severity, total threats, and sites impacted.
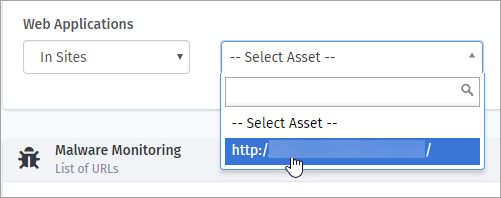
In Site(s)
This option helps a user to display a specific site from the websites registered with MM scans.
Click Web Applications drop-down, click In Site(s) option. Select Asset option displays.
Click Select Asset drop-down, click to select any one of the existing assets. The MM scan details of the selected assets are displayed.
The MM scan details of a specific asset with general information of an asset are displayed. Customer Asset ID is displayed on the top if created otherwise N/A(nil) is displayed.
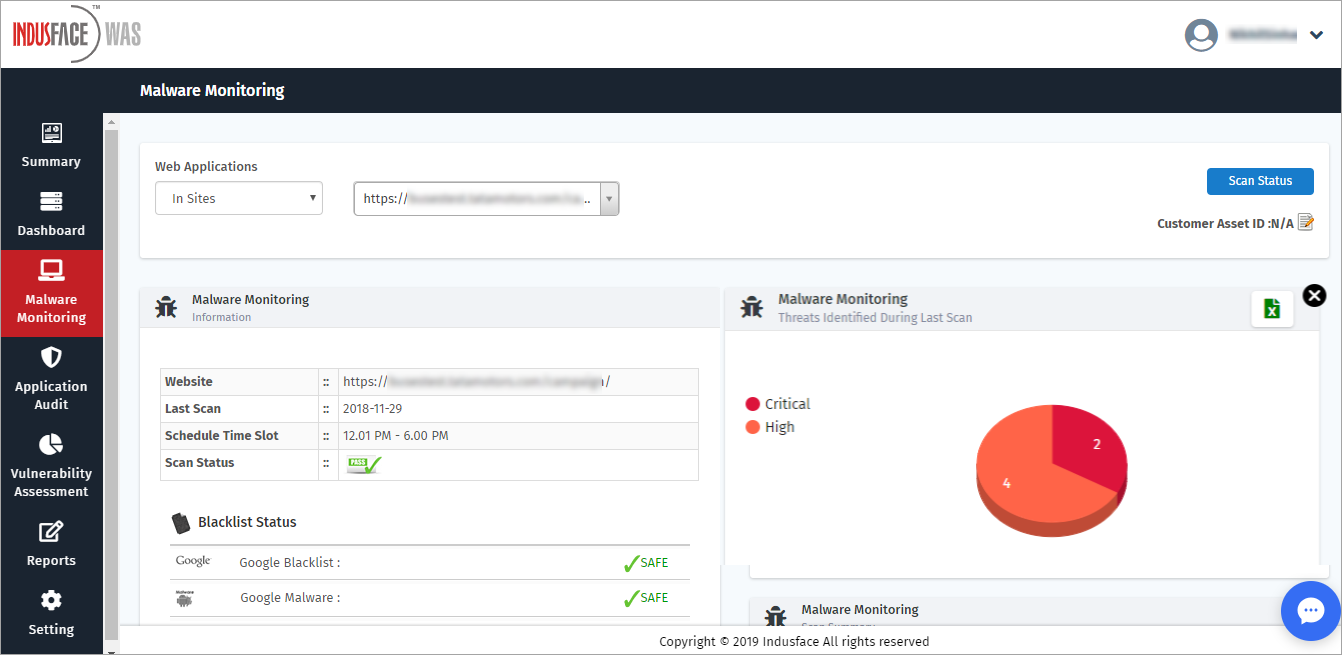
Customer Asset ID
Click Customer Asset ID to create or update a short name for your Asset. Edit Customer Asset ID pop-up appears.

Click Customer Asset ID box, enter an unique ID and click Submit button.
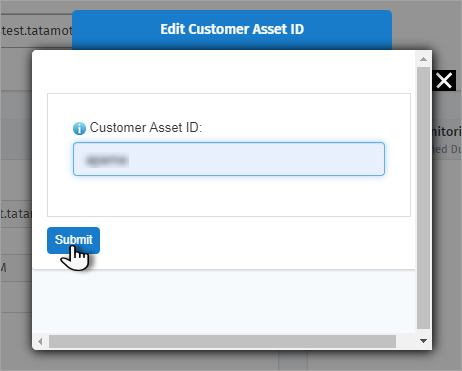
The updated Customer Asset ID is displayed in the MM Scan page.

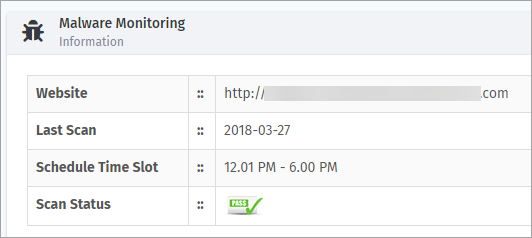
General Info
This displays the basic information of a website or the selected Asset like IP Address, Last Scan, Remaining POC etc.
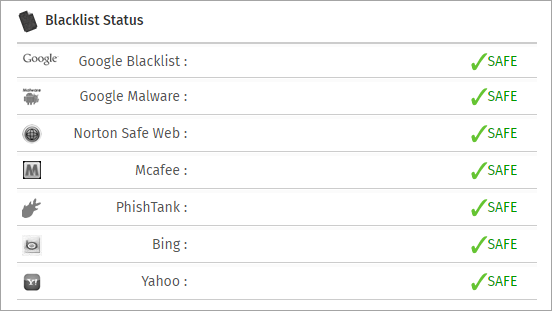
Blacklist Status
The list of databases against which the blacklisting check is done are displayed here. If it is marked Safe, then it means website is not blacklisted in any of the database.
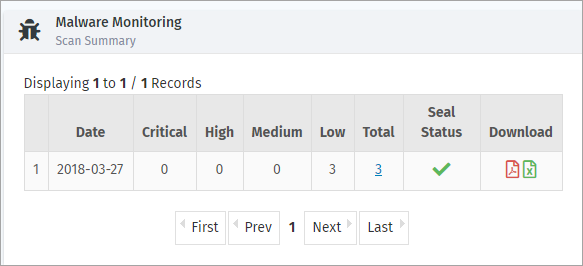
Scan Summary
This option displays the scan details like Scan Date, Vulnerability Type, Total Vulnerabilities, and Seal Status.
Click PDF or Excel icon in Downloads option to download the report of a specific scan.
Aging Summary
This option displays the vulnerabilities open for last 30 (or) 90 (or) 180 days.
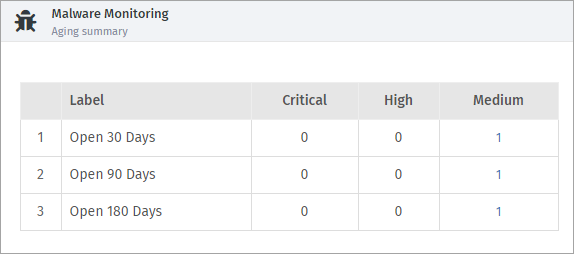
Parameter | Description |
Label | This option displays the number of days a vulnerability is open for ageing summary. |
Critical | This option displays the number of critical vulnerabilities open for the respective days. |
High | This option displays the number of high vulnerabilities open for the respective days. |
Medium | This option displays the number of medium vulnerabilities open for the respective days. |
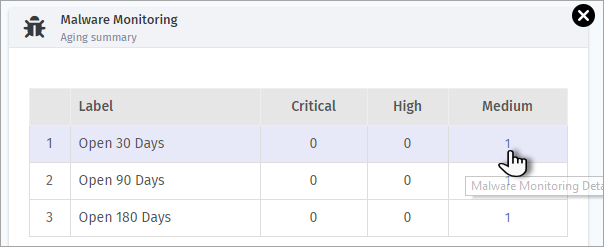
Click the count in respective vulnerability category (i.e., critical, high or medium) to view the further details. MM details pop-up appears.
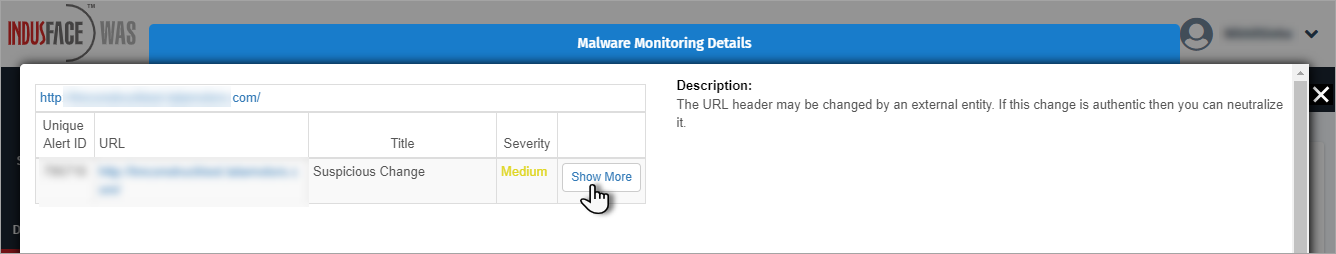
Unique Alert ID, URL, Title, and Severity of the vulnerability is displayed with description on the right.
Click Show More button for further details. Solution and Found date and First Found is displayed.
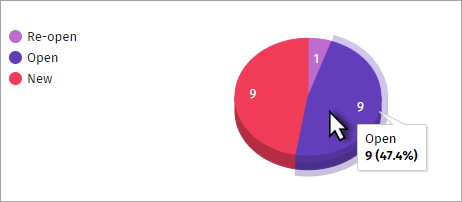
Open Status Identified During Last Successful Scan
Three kinds of open statuses are available with a unique colour i.e., Re-open, Open, and New.
The number of vulnerabilities found in a specific status is displayed in the pie-chart. Mouse over a specific status in the pie chart to view the percentage.