Table of Contents
Dashboard
 Updated
by Rama Sadhu
Updated
by Rama Sadhu
Welcome to the AppTrana Dashboard page.
Please go through the following video to learn about action center and how it works.
Overall protection
This circle graph indicates the protection status of the account, and the total number of websites present in the account.

We differentiated protection status into three categories with three distinct colors.
- Fully Protected
- In the account, all the websites are protected.
- Application with 0 critical and 0 high severity actions pending.
- Fully protected websites are indicated in green color with a numeric value given on the right side of the graph.
- All the vulnerabilities are protected by any of the following rules.
- Core rule
- Custom rule
- Fix required in web application code
- The scan has been done in the last 90 days.
- The manual pentest has been done in the last 180 days.
- WAF status is Log & Block.
- Partially Protected
- In the account, the websites which are not fully protected and the WAF status is Log & Block mode is partially protected.
- Applications with 0 severity action pending and 1 or more high severity actions pending.
- Partially protected websites are indicated in yellow color with a numeric value given on the right side of the graph.
- Not protected
- In the account, the websites that are not fully protected and the WAF status is not Log & Block.
- Application with 1 or more critical severity actions pending.
Action Center
The action center displays the total number of pending actions associated with the account and websites that require immediate action.

From All Applications, select the required application to see the protection status of the website.
For Protected
If an application status is displayed as Protected with green dot, then no action is required for the site. Also, it is denoted with a green mark.

For Partially Protected & Not Protected
- If an application status is displayed as Partially Protected or Not Protected, then in the severity field red colored dot is displayed for Not Protected and yellow colored dot is displayed for Partially Protected.
- The actions are grouped separately for each application. A “+” button is given to see the pending actions.

- Click on the “+” button and go to Action Required field to enable the action.

Use case to Filter the data by Protection Status and Severity
The More Filters button lets users filter the application based on the protection status and severity.

- Select Partially Protected checkbox from the Status menu and Medium checkbox from the severity menu and click Apply.

- All the Partially Protected sites with Medium severity and the count of pending actions associated with the sites are displayed.

- Click on the Reset button to see all the applications.
Criteria | Recommendation | Severity | Action |
Websites not behind WAF | Please route the traffic through AppTrana to get protection. | Critical | - |
Website in Log mode | Website in log mode is not protected. Move the websites to block mode. | Critical | To enable block mode, click ‘Move to Block Mode’
|
Website in bypass mode | Website in bypass mode is not protected. Un-bypass the website. | Critical | Click ‘Unbypass Site’ to trigger the un-bypassing of a website. |
Websites not scanned for 1 month | Start scan to detect vulnerabilities | High | Click ‘Start Scan’ to detect the vulnerabilities. |
Websites are onboarded on Premium plan, but manual PT is not done even after 3 months | Request for the manual PT. | Medium | Click the Request Manual PT button. |
Websites that require custom rules | Protect Vulnerability with custom rules. | Medium | Click the Request Manual PT button. |
Sites where system defined DDOS policy not enabled | Enable DDOS protection and configure the alerts based on the website’s requirements. | Critical | Click ‘Enable DDOS’ and you’ll be navigated to behavioral DDOS page. |
Sites where CDN is not enabled. | Enable the CDN to enhance the user experience of the website. | Medium | To enable CDN, click ‘Enable CDN’ |
Bot protection is in log mode / turned off. | Bot protection is in Log mode. | High | Click on the Enable Bot Protection button. |
Origin IP is exposed to public. | Allow only the registered IP addresses, for more details contact to Support team | High | Block all IPs that do not belong to Indusface - if already done, contact support for manual verification and status update. |
Recommend or Ignore “Enable AppTrana CDN” Action
- Go to the Settings > CDN.
- Select All sites from applications drop-down.

- A checkbox is given to Ignore CDN Status action for all sites.

Trends
Attack trends are categorized into 3-time spans, they are: last 7 days, last 30 days, and last month.

Block | Description |
Total Attacks Blocked | The total number of attacks blocked in the selected time span across all sites is displayed here. After comparison with previous time frame, if there is a spike in attack count, then, the percentage value will be in RED color, otherwise it is GREEN in color. |
Attack Blocked by Custom Rules | The total number of attacks across all sites blocked by custom rules in a selected time span is displayed here. After comparison with previous time frame, if there is a spike in Custom rules count, then, the percentage value will be in RED color, otherwise, it is GREEN in color. |
Total vulnerabilities Detected | The total number of vulnerabilities detected across all sites in a selected time span is displayed here. After comparison with previous time frame, if there is a spike in Vulnerabilities detected, then, the percentage value will be in RED color, otherwise, it is GREEN in color. |
Total Data Transfer | The total data transfer across all sites in the selected time span is displayed here. Data units are represented in GB. After comparison with previous time frame, if there is a spike in Data transfer (In GB), then, the percentage value will be in RED color, otherwise, it is GREEN in color. |
WAF Rules Created | The total WAF rules created for the account in the selected time span is displayed here. After comparison with previous time frame, if there is a spike in WAF rules created, then, the percentage value will be in RED color, otherwise, it is GREEN in color. |
Custom Rules Created | The total custom rules created for the account in the selected time span is displayed here. After comparison with previous time frame. if there is a spike in custom rules created, then, the percentage value will be in RED color, otherwise, it is GREEN in color. |
POC Requested | The number of POC requested for the account in the selected time span is displayed here. After comparison with previous time frame, if there is a spike in requested POC, then, the percentage value will be in RED color, otherwise, it is GREEN in color. |
Scans Completed | The number of scans completed for the account in the selected time span is displayed here. After comparison with previous time frame, if there is a spike in Scans completed, then, the percentage value will be in RED color, otherwise, it is GREEN in color. |
Manual Pentesting Requested | The number of Manual PTs’ completed for the account in the selected time span is displayed here. After comparison with previous time frame, if there is a spike in Scans completed, then, the percentage value will be in RED color, otherwise, it is GREEN in color. |
Protection Trend
The Protection Trend shows important trends around how protection is working in your account.

A) Top 5 Sites Based on Attacks
The top 5 websites in the account which have faced most attacks will be displayed in percentage by descending order.

B) Top 5 Attack Categories
The most common types of attacks are Denial-of-Service attack, SQL injection attack, Cross-Site Scripting attack, Command Injection attack, Bot attacks, and so on. The top 5 attack categories across all your sites will be displayed in percentage by descending order.

C) Top 5 Countries Attack Trend
Select the Top 5 Countries Attack Trend option from the drop-down menu. This shows the top five countries from which attacks originate for the sites configured behind AppTrana.

DDoS Attacks
This section gives the trend of DDOS attacks.
- The total number of sites where DDOS attacks are observed is shown along with total DDOS attacks blocked in your account.
- The graph consists of two sections with a drop-down menu. The Top 5 Sites under Attack and the Top 5 Countries from which Attack originated.

A) Top 5 Sites under Attack
- By default, the "Top 5 Sites under Attack" option is selected.
- This shows the top 5 sites where DDOS attacks are observed along with the number of attacks observed in the selected time frame.

B) Top 5 Countries from which the Attack Originated
- Select the "Top 5 Countries from which Attack originated" from the drop-down menu.
- This shows the top 5 countries from where DDOS attacks are originating for your account.

BOT Attacks
- This section shows the trend of Bot attacks in your account. Requests that are classified as bots and which are blocked by AppTrana.
- The first section gives you the number of sites where Bot attacks were observed and total attacks blocked
- The graph consists of two sections with a drop-down menu. The Top 5 Sites under Attack and the Top 5 Categories of BOT Attacks.

A) Top 5 Sites under Attack
- By default, the Top 5 Sites under Attack is selected.
- This shows the top 5 sites where BOT attacks are observed along with the number of attacks observed in the selected time frame.

B) Top 5 Categories of BOT Attacks
- Select the Top 5 Categories of BOT Attacks from the drop-down menu.
- This shows the top 5 countries from where DDOS attacks are originating for your account.

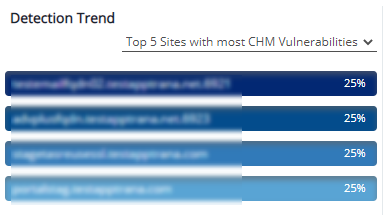
Detection Trend
The following graph explains the details of CHM vulnerabilities and different vulnerability categories found in your account.
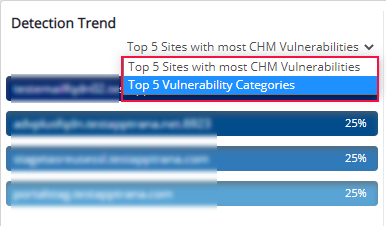
A) Top 5 Sites with most CHM Vulnerabilities
- By default, the “Top 5 Sites with most CHM Vulnerabilities” option is selected, and their data will be displayed in the graph.
- This will display the top 5 sites where CHM vulnerabilities were found in your account in descending order.
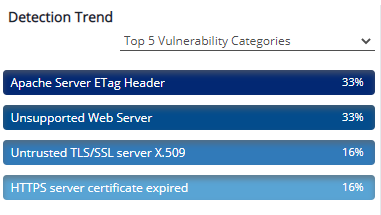
B) Top 5 Vulnerability Categories
- To view the top 5 vulnerability categories, click on the drop-down menu and select the “Top 5 Vulnerability Categories” option.
Vulnerability Status
Vulnerability status is combined with new, open, and closed vulnerabilities. The status displays the number of open, new, and closed vulnerabilities existing in the account.
- The data we are showing in the vulnerability status is the data that is recorded from the last two scans (Current scan and last scan).

Parameter | Description |
New Vulnerabilities | If a vulnerability is present in the current scan but does not exist in the last scan, then it is considered as New Vulnerability. |
Open Vulnerabilities | If a vulnerability is present from the last scan and present scan, then it is considered as an Open Vulnerability. |
Closed Vulnerabilities | If a vulnerability is present in the last scan but does not exist in the present scan, then it is considered a Closed Vulnerability. |
Vulnerability Trend
This pie chart gives the details of the top 5 websites with unprotected vulnerabilities.


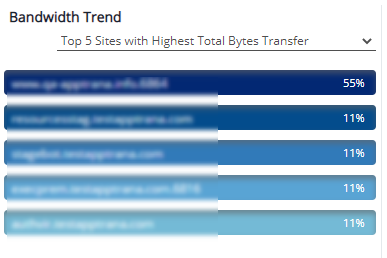
Bandwidth Trend
This shows the trend of data that is received in your account.
- By default, the “Top 5 Countries from which the Requests are Originating” is selected.
- This shows the top 5 countries from which you are getting requests in descending order.
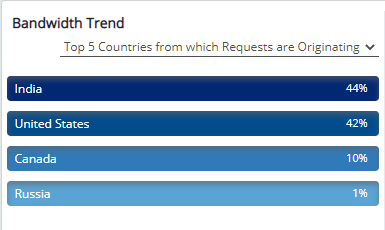
- Click the drop-down menu to view the” Top 5 Sites with Highest Total Bytes Transfer”. Shows the top 5 sites which are most active.
CDN Status
CDN status displays the number of websites for which AppTrana CDN is enabled and Not Enabled.

- If the traffic is passing through the CDN, then the status is Enabled and if not passing through CDN it is considered as Not Enabled.
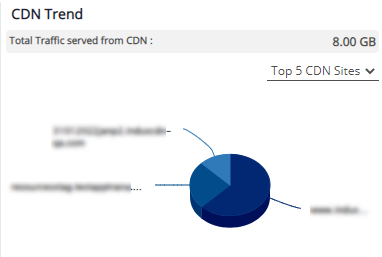
CDN Trend
This CDN trend gives the details around how effective CDN is for your sites.
Account Overview
This section is combined with Plan Trend and License Usage Details.
Plan Trend
This pie chart shows the number of websites onboarded with basic, advance, advance plus, and premium plans.
- Click on any plan and you will see the number of websites onboarded in the selected plan.

License Usage Details
The graph below gives the details of the number of licenses, custom rules, POCs, Manual Pts, and bandwidth utilized in the account and available to use.
Parameter | Description |
License | Here you will see the number of licenses utilized out of the number of licenses purchased. |
Custom Rule | This shows the number of custom rules used out of the number of custom rules purchased. Premium plan has unlimited custom rules |
POC (Proof of Concept) | The total POC utilized out of Total POC purchased. Premium plan has unlimited POC |
Manual Pentest | The number of manual PTs utilized out of the number of manual PTs purchased in the account. |
Bandwidth | The total bandwidth utilized out of the total bandwidth purchased. |
