Table of Contents
Application Audit[AA]

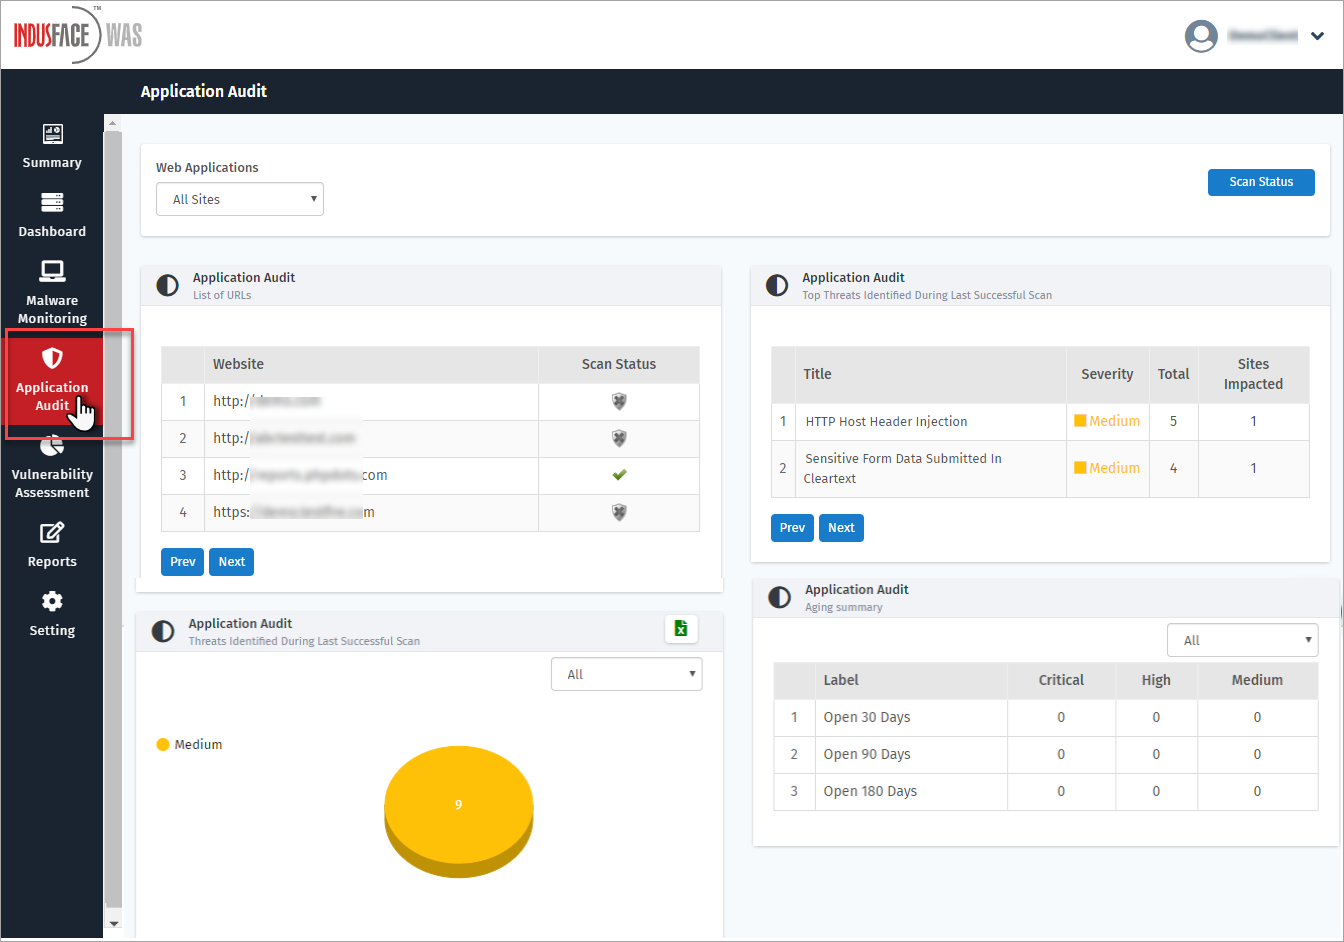
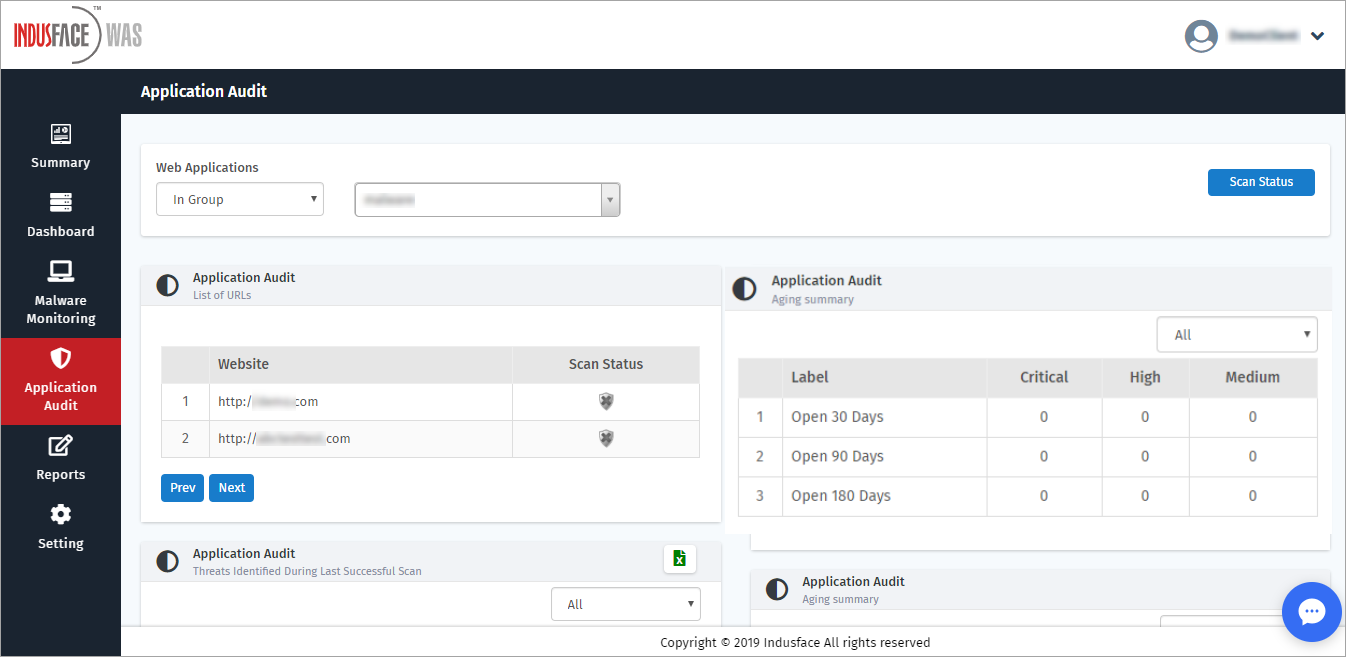
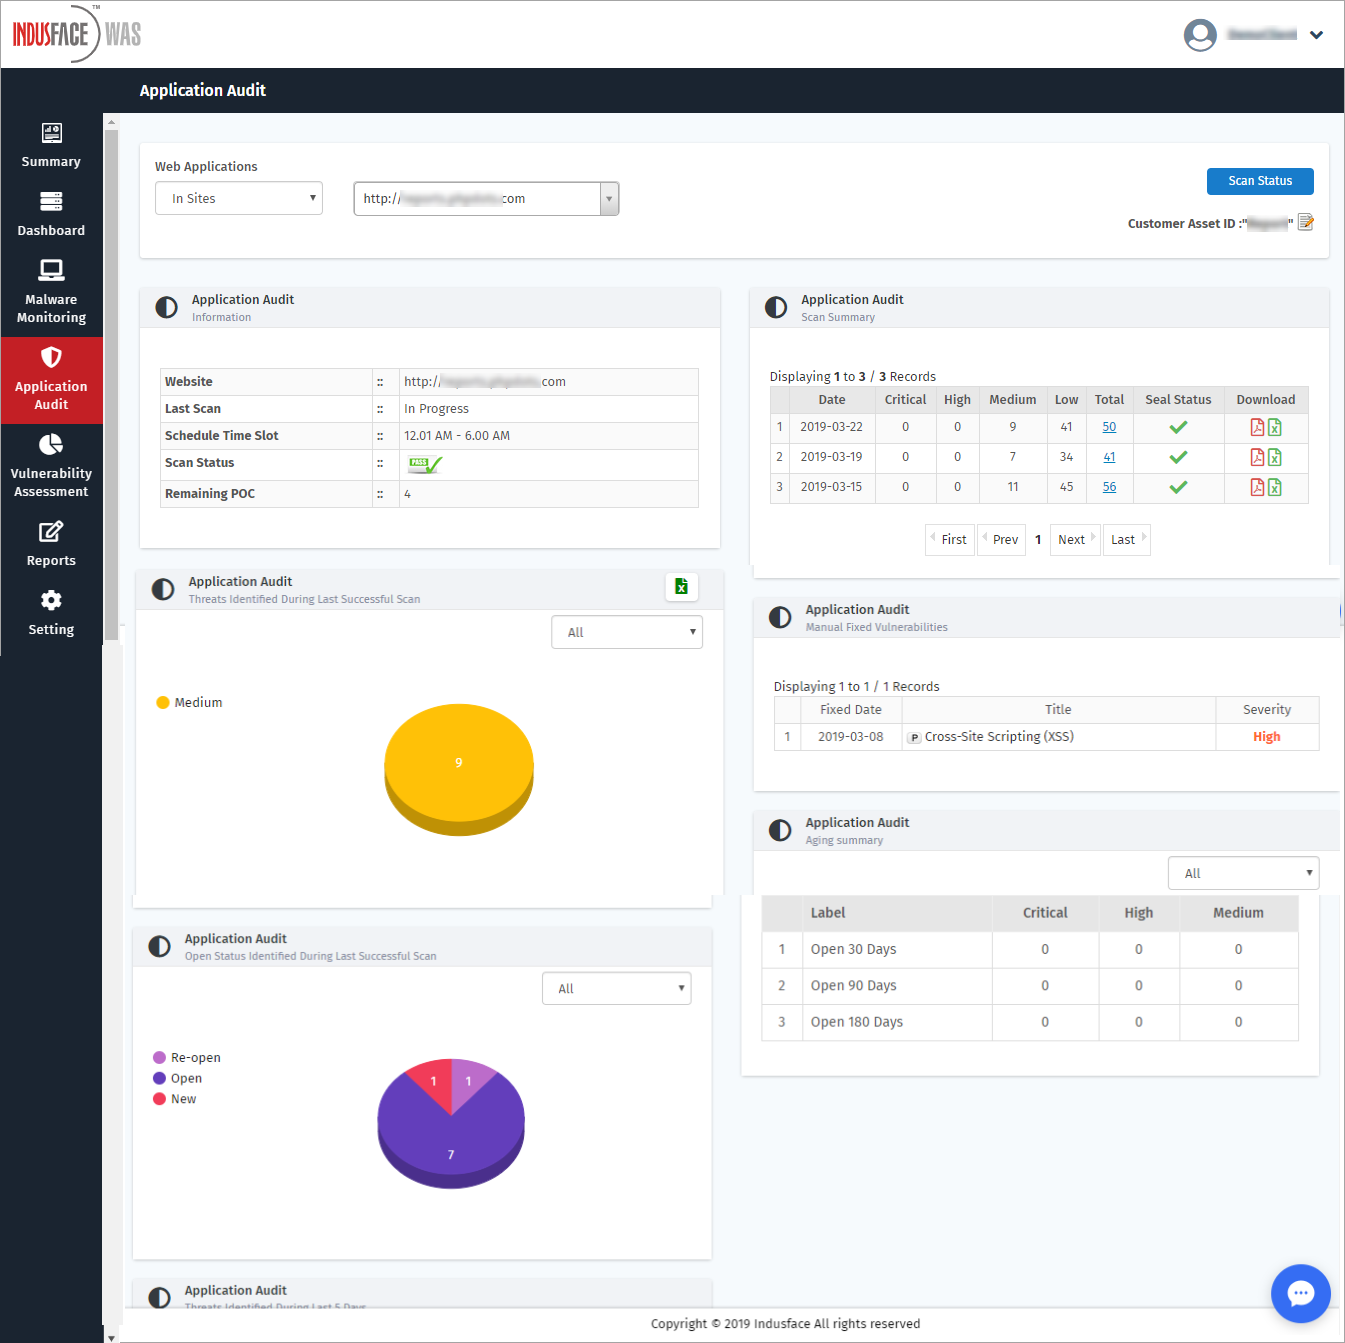
This tab displays all the Application Audit[AA] information like AA Scans, List of Websites registered, Groups Info in the form of widgets. Some of the scan categories are Threats Identified During Last 5 Days, Threats Identified During Last Successful Scan etc.
Click Application Audit on the left navigation plane.
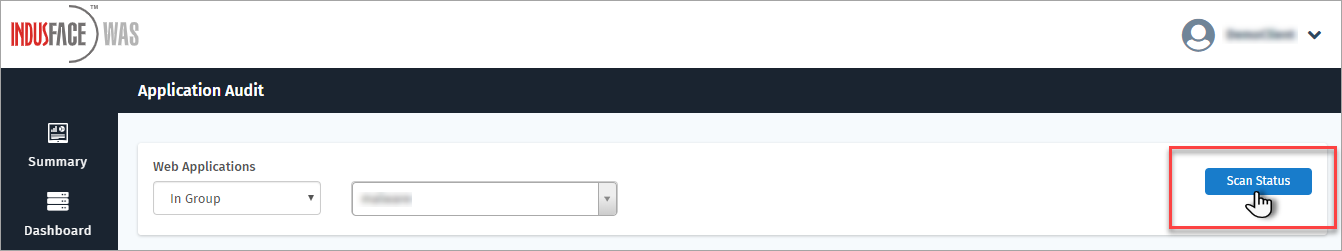
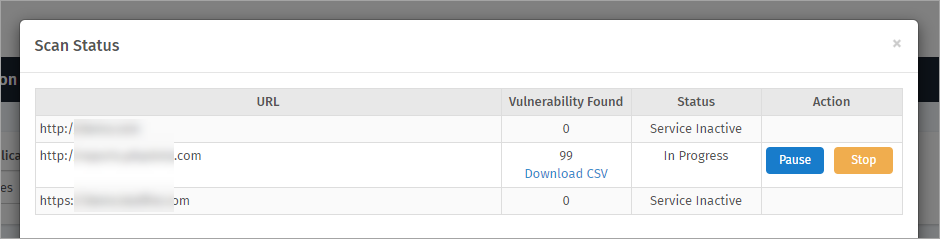
Click Scan Status button to view the scans and services that are active or inactive. Scan Status pop-up appears.
The Scanned Websites with Vulnerabilities Found, Status of the scan and Action column is displayed.
Parameter | Description |
URL | The URL of the scanned websites is displayed in this column. |
Vulnerability Found | The count of the vulnerabilities found from an application is displayed in this column. Click Download CSV link to display the data in the respective format. |
Status | This column displays if a scan service is Inactive or In progress. |
Action | This column displays Start button for active services and Pause and Stop button for in progress scans. |
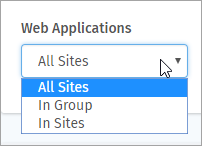
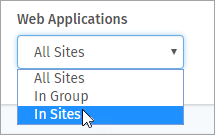
Web Applications
By default, All Sites option is selected by opening AA page. In Group(s) or In Site(s) options to display only a specific group or a website from the existing.
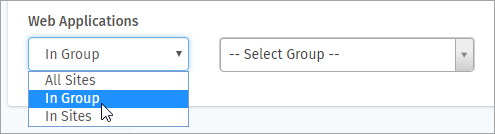
In Group(s)
Click In Group(s) option from Web Applications drop-down. Select Group drop-down appears.
Click Select Group drop-down and click to select a group. The scan summary details of the group are displayed.
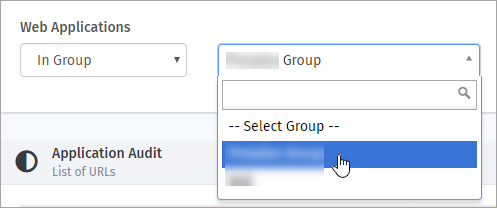
List of IP Address in the group and various other AA scan reports of the selected group are displayed.
Click  to download the report in CSV format.
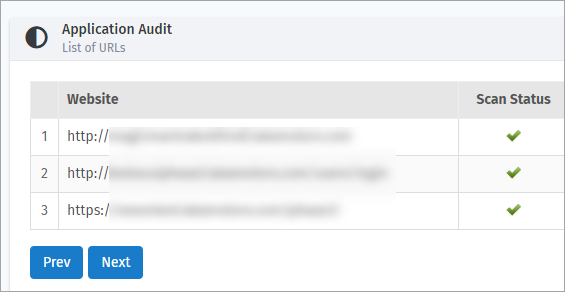
List of URLs
This widget displays the Website URLs registered for Application Audit scan and their Scan Status.
Scan Status is displayed  , if your Application Audit[AA] has passed the last Indusface WAS Security Scan. It does not have any critical alert.
Scan Status is displayed  , if Indusface WAS security scan is running or not yet started your AA service.
Scan Status is displayed  , if there is one or more critical alert found in the last AA scan.
In Site(s)
Click In Site(s) option from Web Applications drop-down. Select Asset option appears.
Click Select Asset drop-down and click to select an asset. Application Audit scan details of the selected website is displayed.
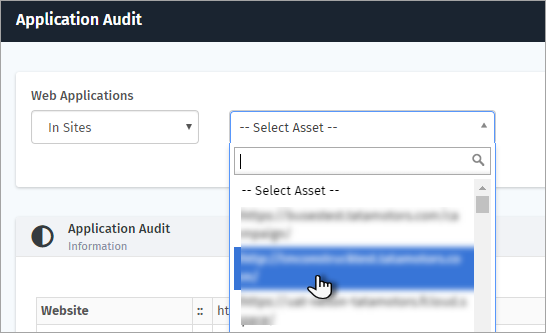
The AA scan details performed on a specific website like Scan Summary, Threats Identified, Aging Summary etc., are displayed. The AA information i.e., Website Name, Last Scan, Scan Status etc., are displayed.
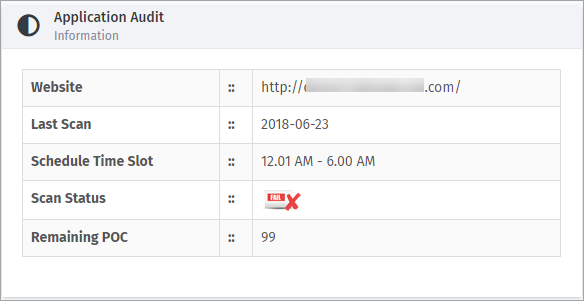
Information
The selected asset information like Website URL, Last Scan, Schedule Time Slot etc., is displayed in this field. Remaining POC option displays the number of POC requests that can be made.
Scan Summary
This option displays the scan details such as Scan Date, Scan Status, Scan Type, and so on.

- Click on the Eye icon in the Download column to download the scan summary data in HTML format.
- Click on the PDF icon in the Download column to download the scan summary data in PDF format.
- Click on the Excel workbook icon in the Download column to download the scan summary data in CSV format.
- The URI Site Map will be displayed only when the scanner provides the data.
Rescan/ Revalidate Scan
The Rescan feature helps users to quickly rescan and revalidate their previous scan’s results. This helps users to save time on checking if the initially detected vulnerabilities in the previous scan have been fixed or not.
Here are a few important details:
- The Start Rescan button will be enabled only if there is a scan record present in the selected website.

- To start the rescan, click on the Start Rescan button. The following confirmation pop-up appears next.

- Click on the Yes button to request the rescan. The following success pop-up appears next.

- Once the scan is completed successfully, the rescanned record will be displayed in Scan Summary table.
 For a website, when the rescan is already in progress, if you request for the rescan, then, you will get an error pop-up showing the rescan is in progress.
Scan Log Reports
This report displays the following information on the vulnerabilities found - vulnerability title, severity, found on which website, vulnerability found date, and reopened date.
To view the detailed report, click on the number in the Total column, and the Scan Log Reports page will open.

- Users can download the scan log data by using the Export PDF and Export CSV options.
- Click on the Show More button to see the full details of the vulnerability and for the POC details click on the Request POC button.
- A confirmation pop-up will appear for POC requests. Click on the OK button to confirm.

- Click on the Evidence button to see the POC details of the vulnerability and for the manual verification, click on the Request Manual Verification button.
- A confirmation pop-up will appear for manual verification. Click on the OK button to confirm.

Whitelisting Vulnerabilities
- Click on the Whitelist button to whitelist the vulnerability.

- A new window will open to enter the inputs. Select the Alert or Plugin which you want to whitelist.
- In the Comments field, enter the reason for whitelisting.
- In the End Date field, select a date till you want to whitelist the vulnerability, and then click on the Submit button.
- A confirmation pop-up will appear, click OK to confirm.
- Once the vulnerability is whitelisted successfully, an email will be sent to the user with basic details.

- Also, the Whitelist button in the vulnerability field will turn as whitelisted.

- When a user whitelists a plugin, all the vulnerabilities with the same title will be whitelisted automatically.
Whitelisting Multiple Vulnerabilities
- To whitelist multiple vulnerabilities, select the vulnerabilities by clicking on the check boxes, and then, click on the Whitelist Alerts/ Plugins button.
- A new window will open to enter the inputs, select the Alert/Plugin button.
- In the Comments field, enter the reason for whitelisting.
- In the End Date field, select a date till you want to whitelist the vulnerability, and then click on the Submit button.
- A confirmation pop-up will appear, click OK to confirm.
- Once the vulnerability is whitelisted successfully, an email will be sent to the user with basic details.


- Also, the Whitelist button in the vulnerability field will turn as whitelisted.
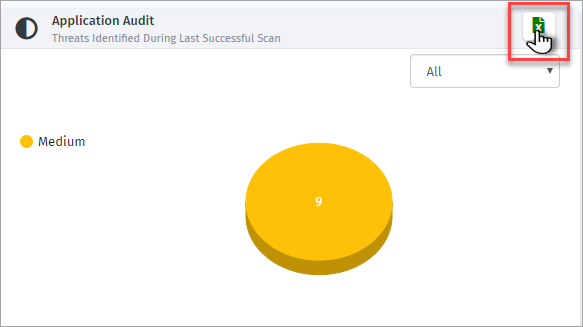
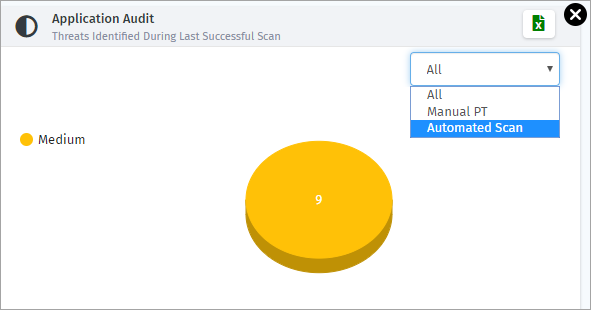
Threats Identified During Last Successful Scan
This widget displays the threats found in the last scan as Critical, High, Medium, and Low according to the severity in the form of a pie chart. In this example, only Medium vulnerabilities are discovered.
Click All drop-down and click to select Manual PT or Automated Scan.
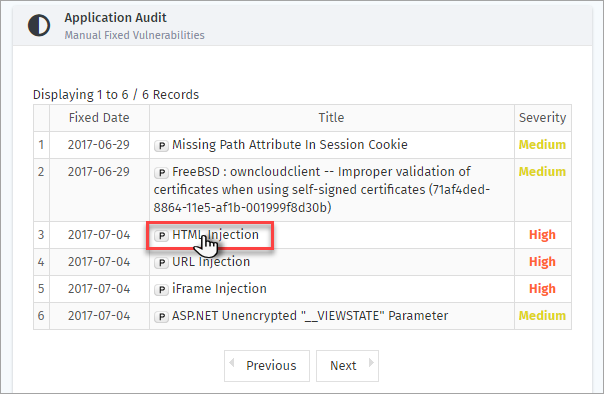
Manual Fixed Vulnerabilities
The list of fixed vulnerabilities is displayed in this option. Fixed Date, Title of the Vulnerability, and the Severity of it.
Click a specific vulnerability to display further details. AA pop-up of a specific fixed vulnerability is displayed.
Aging Summary
This option displays the vulnerabilities open for last 30 (or) 90 (or) 180 days.
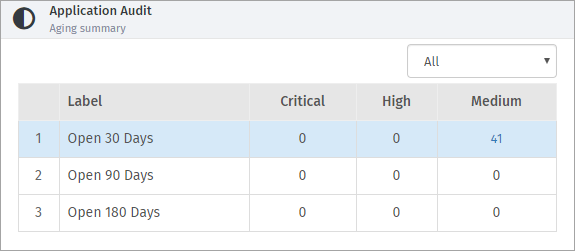
Parameter | Description |
Label | This option displays the number of days a vulnerability is open for ageing summary. |
Critical | This option displays the number of critical vulnerabilities open for the respective days. |
High | This option displays the number of high vulnerabilities open for the respective days. |
Medium | This option displays the number of medium vulnerabilities open for the respective days. |
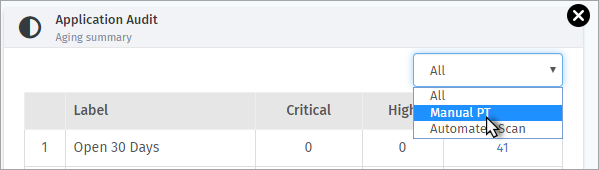
Click All drop-down and select Manual PT or Automated Scan option to display the respective vulnerabilities.
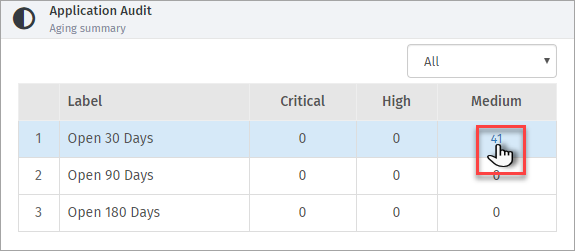
Click the number in respective vulnerability category (i.e., critical, high or medium) to view the further details. Application Audit Details pop-up appears.
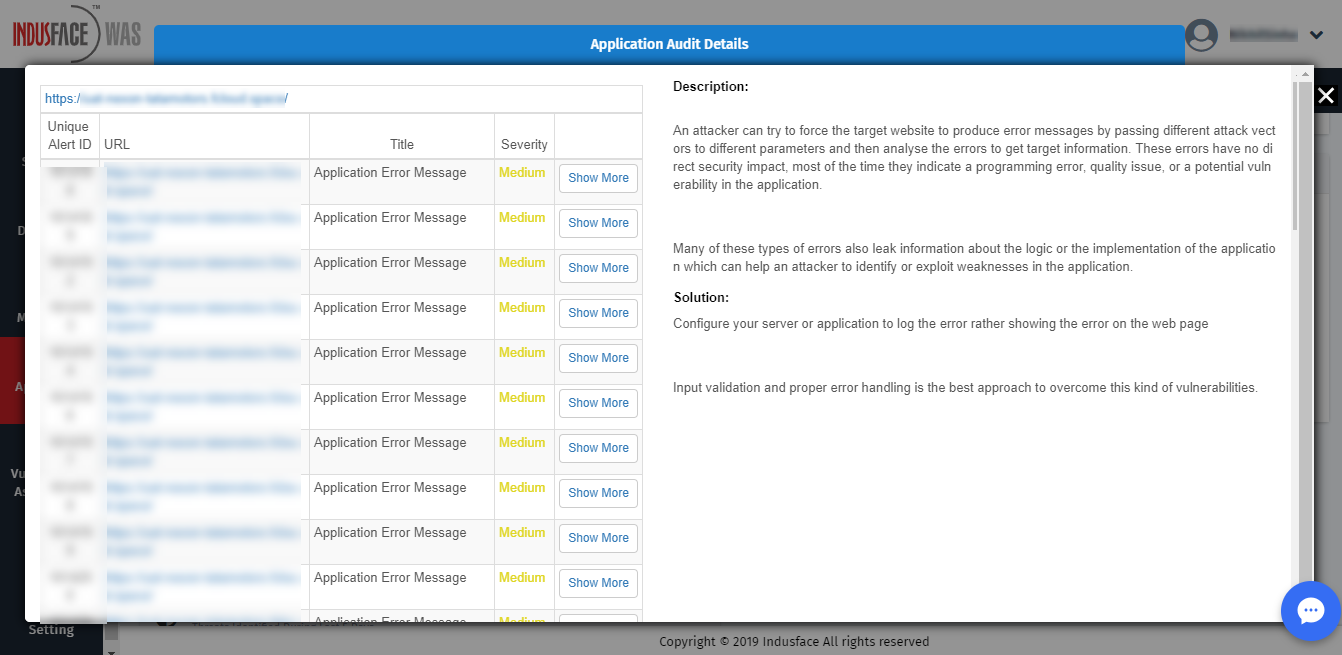
The Unique Alert ID, URL, Title of the vulnerability, and Severity of the open vulnerabilities is displayed. The general Description and Solution is displayed on the side.
Click Show More button of a specific open vulnerability to view further details.
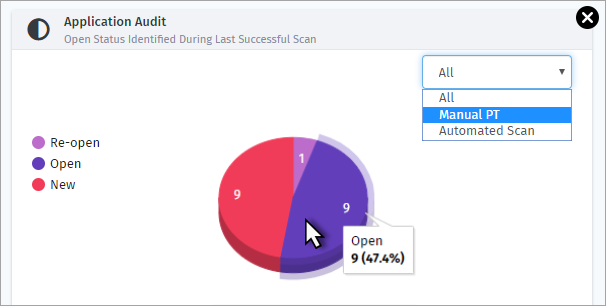
Open Status Identified During Last Successful Scan
Three kinds of open statuses are available with a unique colour i.e., Re-open, Open, and New. Mouse over a specific status in the pie chart to view the percentage.
Click All drop-down, click Manual PT or Automated Scan to display respective vulnerabilities.