AppTrana
Getting Started
Frequently Asked Questions
Product Details
API Scan Coverage for OWASP Top 10
Whitelist Vulnerabilities on the AppTrana WAAP
API Request to Purge CDN Data
Analysis page - Attack Trend Visualisation
Advanced Behavioral DDoS
BOT Protection
Asset Discovery
Customize Application Behavior with Bot Score
Restricted Admin User
Self Service Rules
Configuring Custom Error Page in AppTrana
Enabling SIEM Integration
API Discovery Feature
SwyftComply
Analysis page - Access Trend Visualization
Manage WAAP Email Alerts
Enable and Configure Single Sign-On
WAF Automated Bypass and Unbypass
False Positive Analysis Report on WAAP
Product User Guide
Indusface WAS
Getting Started
Product User Guide
Summary
Dashboard
Malware Monitoring[MM]
Application Audit[AA]
Vulnerability Assessment[VA]
Reports
Settings
Asset Monitoring
New Reporting Structure
Frequently Asked Questions
Feature Summary
AcuRisQ – Risk Management with Advanced Risk Scoring
WAS Consulting License
API Key Based - Scan Log Export
WAS Defacement Checks
SIEM Integration with Sumo Logic
Indusface WAS Scanned Vulnerabilities
Total Application Security
Onboarding Documents
Indusface Newsletter
Indusface Product Newsletter - October 2021
Indusface Product Newsletter- April 2021
Indusface Product Newsletter-January21
Indusface Product Newsletter - June 20
Indusface Product Newsletter - October 19
Indusface Product Newsletter - August 19
Product Newsletter of May 19
Product Newsletter of March 19
Product Newsletter of January 19
WAF Portal Revamp June 18
Product Newsletter of July 18
Product Newsletter of May 18
Product Newsletter of March 18
Product Newsletter of February 18
Product Newsletter of January 18
Indusface Product Newsletter - March 2022
Indusface Product Newsletter - February 2023
Indusface Product Newsletter- October 2022
Zero Day Vulnerability Reports
Vulnerabilities Detected in 2023
Vulnerability Report of May 23
Vulnerability Report of March 23
Vulnerability Report of August 23
Vulnerability Report of July 23
Vulnerability Report of April 23
Vulnerability Report of November 23
Vulnerability Report of June 23
Vulnerability Report of December 23
Vulnerability Report of February 23
Vulnerability Report of January 23
Vulnerability Report of September 23
Vulnerability Report of October 23
Vulnerabilities Detected in 2016
CRS vs. Zero Day Vulnerability - December 2016
CRS vs. Zero Day Vulnerability - November 2016
CRS vs. Zero Day Vulnerability - October 2016
CRS vs Zero Day Vulnerability - September 2016
CRS Vs Zero Day Vulnerabilities - August 2016
Vulnerabilities Detected in 2017
Vulnerability Report of April 17
Vulnerability report for Apr 3rd - Apr 9th 17
Vulnerability report for April 17th - Apr 23rd 17
Vulnerability report of April 10th - April 16th
Vulnerability Report of March 17
Vulnerability report for Mar 20th - Mar 26th
Vulnerability report for Mar 13th - Mar 19th
Vulnerability report for 27th Feb - 5th Mar
Vulnerability report for Mar 27th - Apr 2nd
Vulnerability report for Mar 6th - Mar 12th
Vulnerability Report of February 17
Vulnerability Report of January 17
Vulnerability Report of December 17
Vulnerability Report of November 17
Vulnerability Report of August 17
Vulnerability Report of September 17
Vulnerability Report of October 17
Vulnerability Report of July 17
Vulnerability Report of June 17
Vulnerability Report of May 17
Vulnerabilities Detected in 2018
Vulnerability Report of December 18
Vulnerability Report of November 18
Vulnerability Report of October 18
Vulnerability Report of September 18
Vulnerability Report of August 18
Vulnerability Report of July 18
Vulnerability Report of June 18
Vulnerability Reports of May 18
Vulnerability Report of April 18
Vulnerability Report of March 18
Vulnerability Report of February 18
Vulnerability Report of January 18
Vulnerabilities Detected in 2019
Vulnerability Report of December 19
Vulnerability Report of November 19
Vulnerability Report of October 19
Vulnerability Report of September 19
Vulnerability Report of August 19
Vulnerability Report of July 19
Vulnerability Report of June 19
Vulnerability Report of May 19
Vulnerability Report of April 19
Vulnerability Report of March 19
Vulnerability Report of February 19
Vulnerability Report of January 19
vulnerabilities Detected in 2020
Vulnerability Report of December 20
Vulnerability Report of November 20
Vulnerability Report of October 20
Vulnerability Report of Sep 20
Vulnerability Report of July 20
Vulnerability Report of June 20
Vulnerability Report of May 20
Vulnerability Report of April 20
Vulnerability Report of March 20
Vulnerability Report of February 20
Vulnerability Report of January 20
Vulnerabilities Detected in 2021
Vulnerability Report of November 21
Vulnerability Report of October 21
Vulnerability Report of September 21
Vulnerability Report of August 21
Vulnerability Report of July 21
Vulnerability Report of June 21
Vulnerability Report of May 21
Vulnerability Report of April 21
Vulnerability Report of March 21
Vulnerability Report of February 21
Vulnerability Report of January 21
Vulnerability Report of December 21
Vulnerabilities Detected in 2022
Vulnerability Report of January 22
Vulnerability Report of February 22
Vulnerability Report of March 22
Vulnerability Report of April 22
Vulnerability Report of May 22
Vulnerability Report of June 22
Vulnerability Report of July 22
Vulnerability Report of August 22
Vulnerability Report of September 22
Vulnerability Report of October 22
Vulnerability Report of November 22
Zero-Day Vulnerability Report - December 2022
Vulnerabilities Detected in 2024
Security Bulletin
Vulnerabilities 2024
Critical Apache OFBiz Zero-day AuthBiz (CVE-2023-49070 and CVE-2023-51467)
ScreenConnect Authentication Bypass (CVE-2024-1709 & CVE-2024-1708)
CVE-2024-1071 – Critical Vulnerability in Ultimate Member WordPress Plugin
Oracle WebLogic Server Deserialization
ApacheStructs_VG
Apache Struts 2 Vulnerability CVE-2023-50164 Exposed
Unpacking the Zimbra Cross-Site Scripting Vulnerability(CVE-2023-37580)
Adobe ColdFusion Vulnerabilities Exploited in the Wild
Remote Unauthenticated API Access Vulnerabilities in Ivanti
Multiple Moveit Transfer Vulnerabilities
HTTP/2 Rapid Reset Attack Vulnerability
Apache log4j RCE vulnerability
Table of Contents
- All Categories
- AppTrana
- Product Details
- Analysis page - Attack Trend Visualisation
Analysis page - Attack Trend Visualisation
 Updated
by Rama Sadhu
Updated
by Rama Sadhu
This page displays the analysis of Attack Logs. Users can easily filter and summarize the data by applying multiple filters.
Product Walkthrough - Attack Log Analysis on AppTrana
Attack Logs
This page displays the details of Malicious or Attacker IP address, URL, Country of the attacker, Attack category, date and time of the attack, severity of the attack and much more.
Click Attack Logs tab in Analysis page.

To get the broad picture of attack logs, apply the filters to get the summarized data.
Filter data by severity
We measure severity into three different categories as Critical, High, and Medium. Selected severity data will be shown.
All- Critical, High, and Medium severy attack log details are displayed.
Critical- Critical severity attack details only displayed.
High- High severity attack details are displayed
Medium- Medium severity attack details are displayed.

Filter data by Action
Action field has three parameters such as All, Block, and Log.
All- All the Blocked and logged attacks data is displayed.
Block- Blocked attacks data is displayed.
Log- Logged attacks data is displayed.

Filter data by Category
Enter the attack category in category field to show only the specified category details.

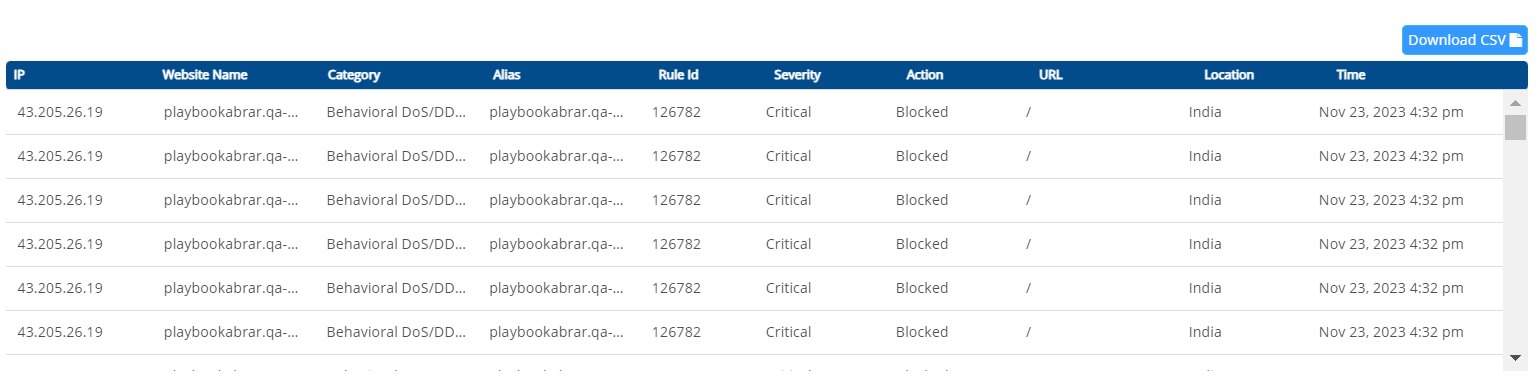
After applying all the filters, a table is generated with details such as IP, Website name, Category, and so on.
Parameter | Description |
IP | A malicious IP address attacking a website using a specific rule is displayed in this column. |
Website name | Name of the site |
Category | This column displays the attack category of a specific IP address. |
Alias | Subdomain route through the main domain |
Rule Id | The unique number of the attack rule is displayed in this column. |
Severity | This column displays, how critical an attack log which is blocked or logged i.e., Critical, High or Medium is displayed. |
Action | This column display if an attack blocked or logged. |
URL | A malicious URL used to access a website is displayed in this column. |
Location | This column displays the geographical location of an attacker. |
Time | The exact time and date of an attack is registered and displayed in this column. |
- Click Download CSV button to get the attack logs details in CSV format.
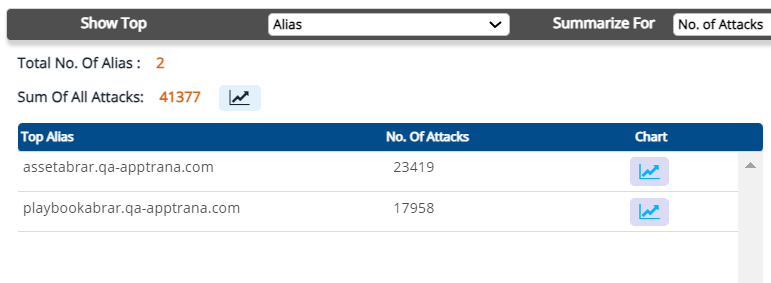
Show Summary for Attack Logs
- From Show Top, select the parameters such as IP, URL, Country, Alias, Action, and Category.
- Summarize based on number of attacks.
- Go to List Top and select the number.

After applying, all the filters click Show Summary.
The summary contains a top list of data.
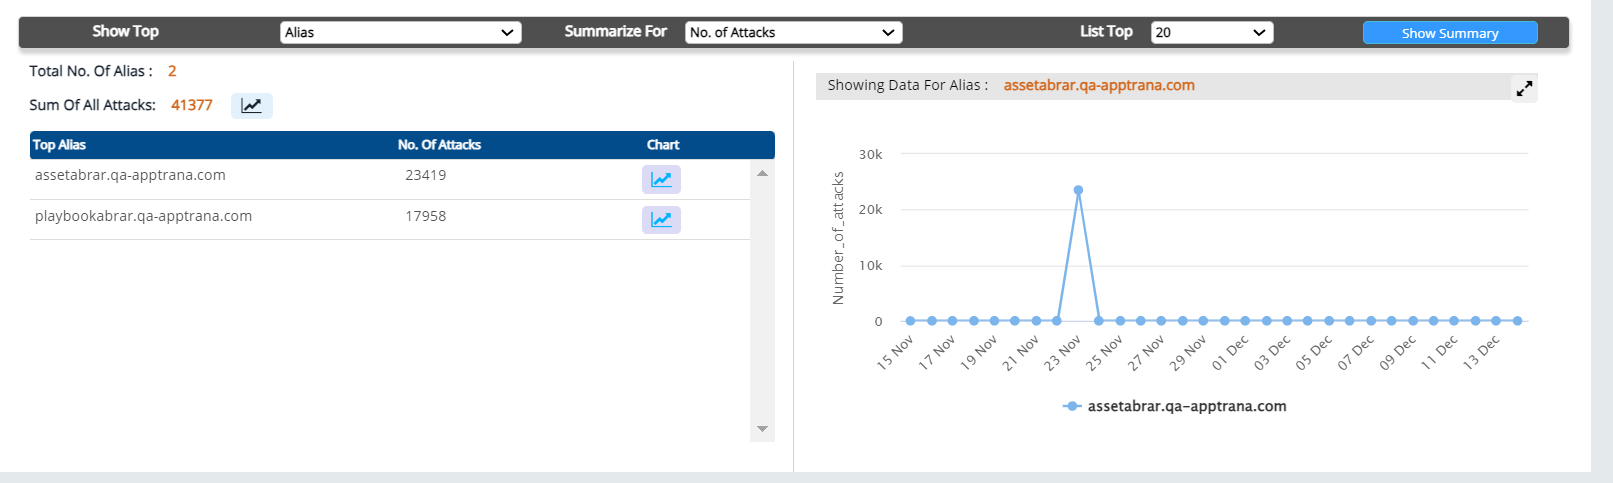
In the below example, We have overall 2 different aliases with 41377 attacks cumulatively. The table gives details of each aliases and number of attacks along with the chart separately.
User can go to any of the alias and check the trend graph separately.
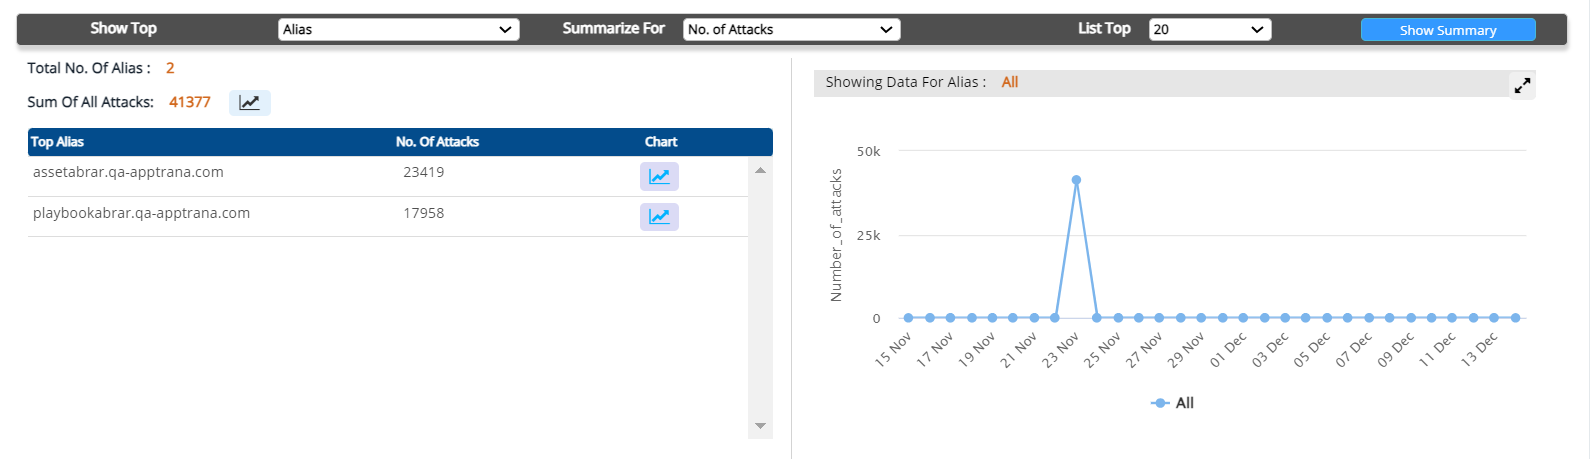
Also, users can click on the trend icon given in Sum of All Attacks field to display the summarized data in graph.
Trend for Sum of All Attacks(All Aliases):
Trend for Selected Alias: