Table of Contents
Analysis

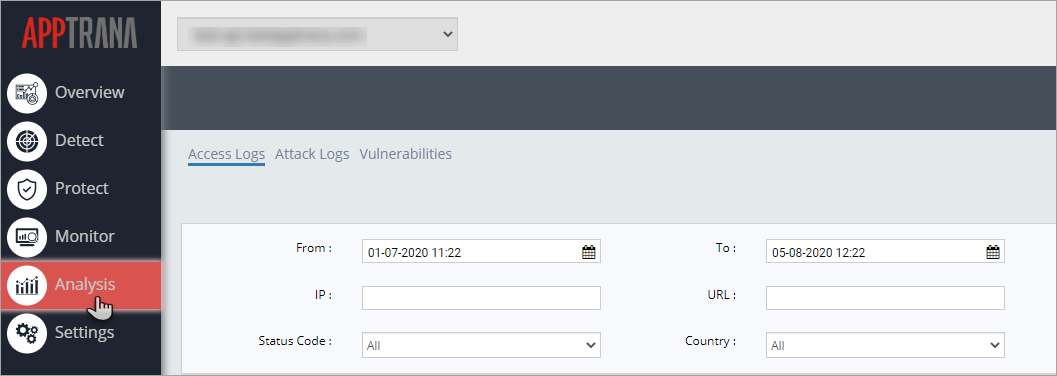
This page displays the analysis of data logs in three categories as Access Logs, Attack Logs, and Vulnerabilities. Attacker IP Address, URL, Attacker Location, Time of the attack etc., details are displayed in a tabular form in all the pages.
Click Analysis tab on the left navigation plane to go through further details.
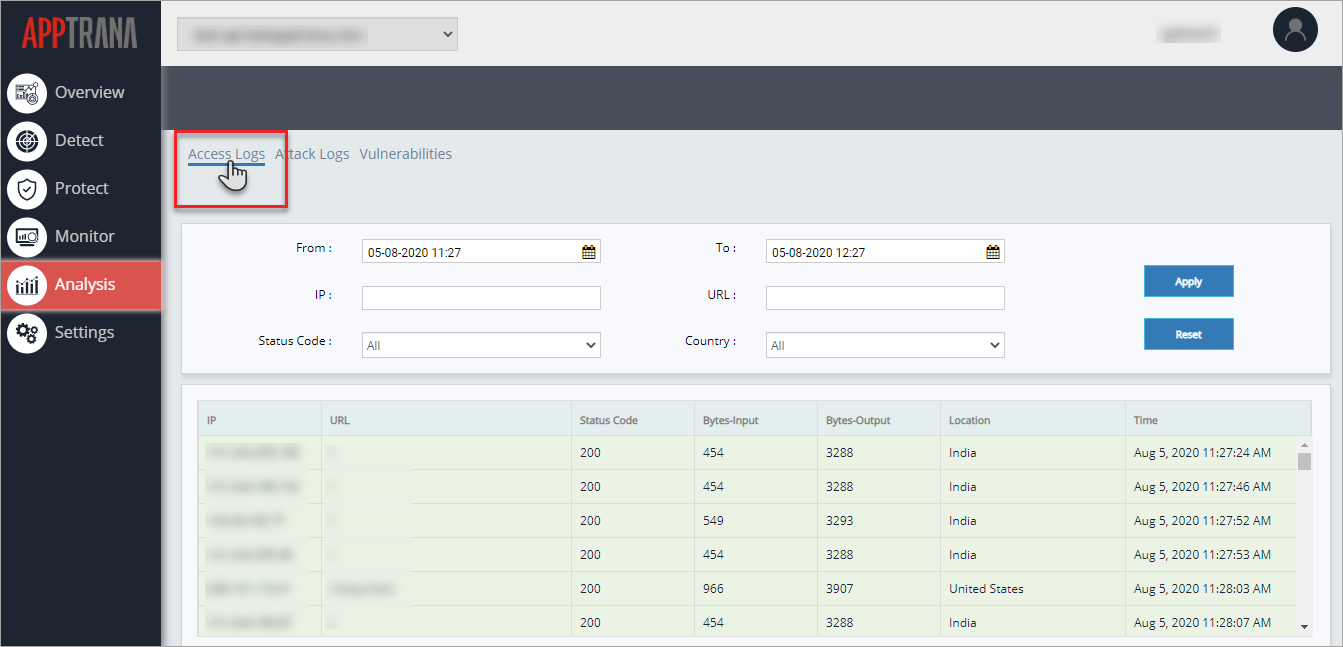
Access Logs
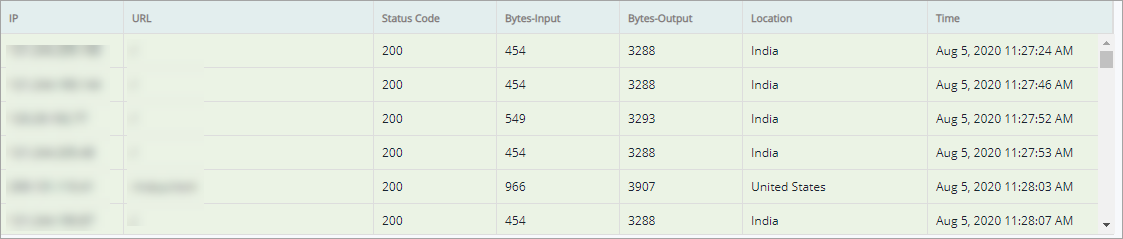
The details of the IP addresses, URLs, Country etc., of an user trying to access a specific website is displayed after a thorough analysis. The date and time of the attempt to access, displayed status code, Byte input and output specifics is displayed.
In order to detail down the log list, few search measures are been made. For Example:
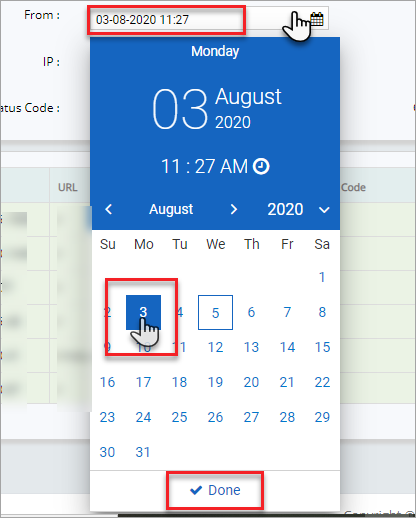
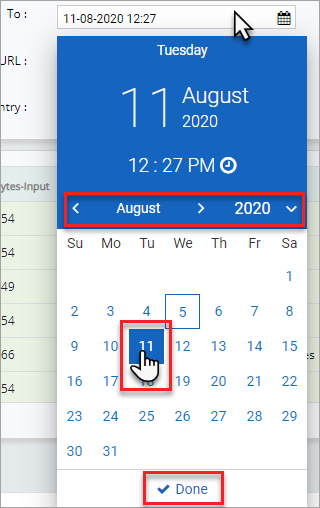
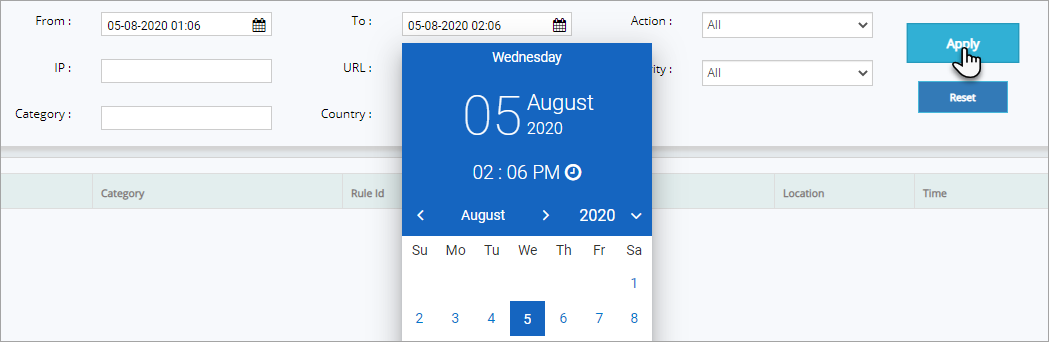
Click From calendar drop down, click and adjust month and the year, click a specific digit to select a date. and then click Done button.
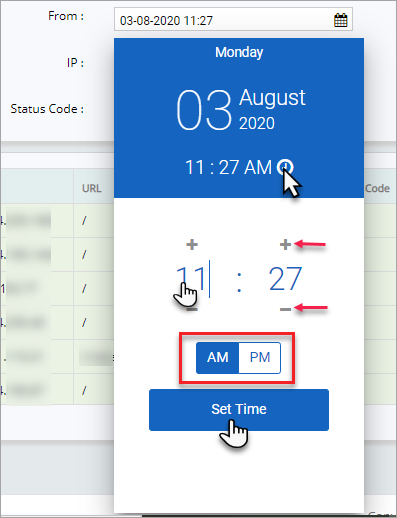
To select the logs from a specific time along with date,
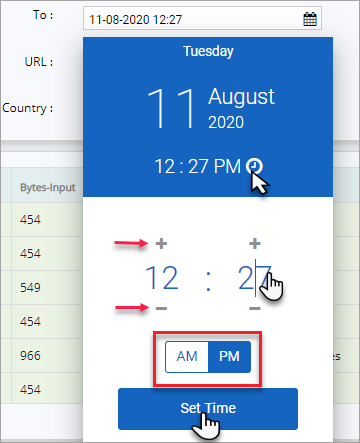
Click the time displayed by default to open the time settings.
Either click on the number and change the digits to the hours and minutes as necessary or click "+" and "-" symbol to adjust the time as needed.
Click and adjust AM or PM and then click Set Time button.
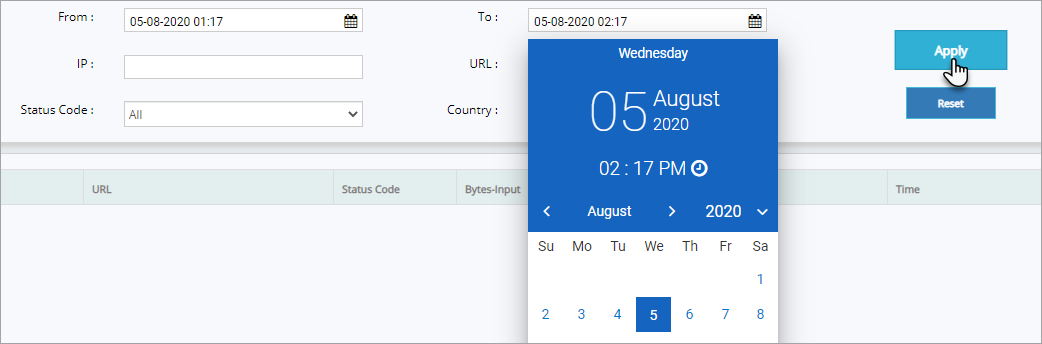
Click To calendar drop down, click to select a specific date and time till when the log information need to be displayed, and click Done button.
To select the logs to a specific time along with date,
Click the time displayed by default to open the time settings.
Either click on the number and change the digits to the hours and minutes as necessary or click "+" and "-" symbol to adjust the time as needed.
Click and adjust AM or PM and then click Set Time button.
Click Apply button to apply the changes and to view the access logs for the specified days.
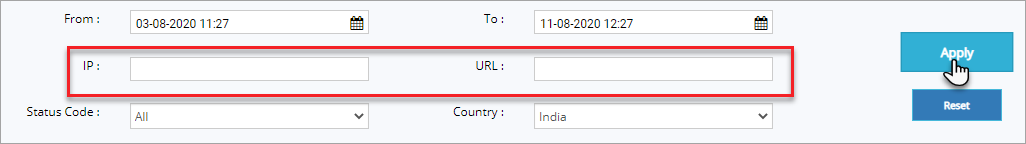
Click IP field, enter the IP address and then click Apply button to display the log details on that specific IP.
Similarly, click URL field, enter the url and then click Apply to view the details of access logs for the same. Click Reset button to change the IP address.
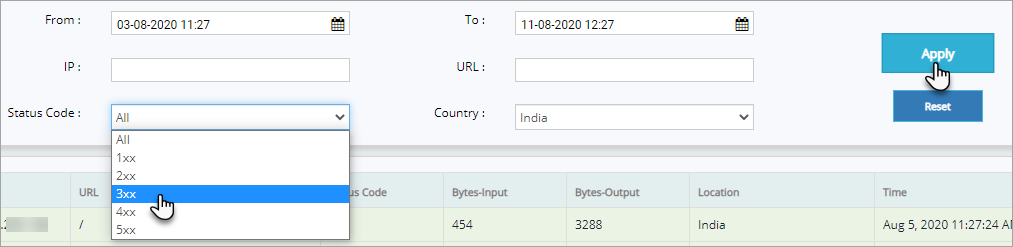
Click Status Code drop down, click to select a specific status code, and then click Apply button to display the logs on that specific status code.
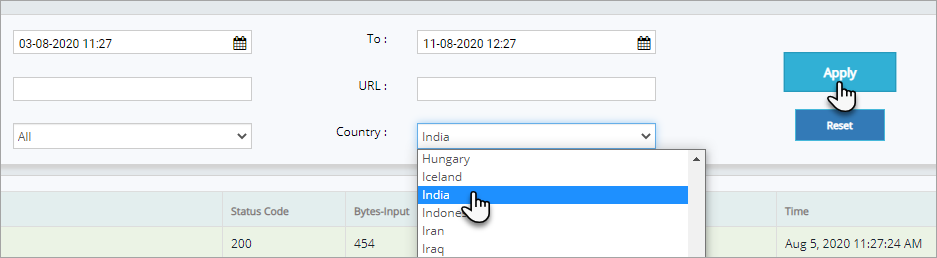
Click Country drop down, click first letter of the country for quick search an then click Apply button to display the access logs of that specific country.
As per the selection(s) access log data is updated.
Parameter | Description |
IP | A suspicious IP address used to access a certain website maliciously producing a specific error status code is displayed in this field. |
URL | A suspicious URL used to access a website is displayed in this column. |
Status Code | The Error status code displayed by a specific URL and IP address at a specific time is displayed in this column. |
Bytes-Input | This column displays the byte size of the input or upload during the access. |
Bytes-Output | This column displays the byte size of the output or download during the access. |
Location | This column displays the geographical location of the person trying to access the system. |
Time | The exact time and date of the action is registered and displayed in this column. |
Attack Logs
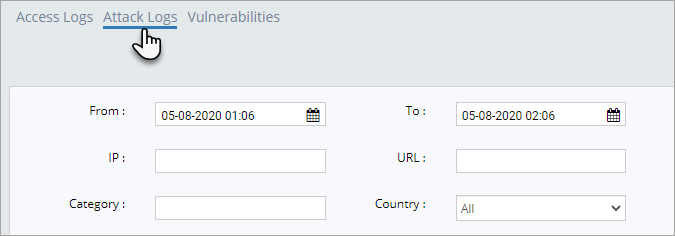
This page displays the details of Malicious or Attacker IP address, URL, Country of the attacker, Attack category, date and time of the attack, severity of the attack and much more.
Click Attack Logs tab in Analysis page.
In order to detail down the log list, few search measures are been made. For Example:
Click From calendar drop down, click and adjust month and the year, click a specific digit to select a date. and then click Done button.
To select the logs from a specific time along with date,
Click the time displayed by default to open the time settings.
Either click on the number and change the digits to the hours and minutes as necessary or click "+" and "-" symbol to adjust the time as needed.
Click and adjust AM or PM and then click Set Time button.
Click To calendar drop down, click to select a specific date and time till when the log information need to be displayed, and click Done button.
To select the logs to a specific time along with date,
Click the time displayed by default to open the time settings.
Either click on the number and change the digits to the hours and minutes as necessary or click "+" and "-" symbol to adjust the time as needed.
Click and adjust AM or PM and then click Set Time button.
Click Apply button to apply the changes and view the attack logs for the specified days.
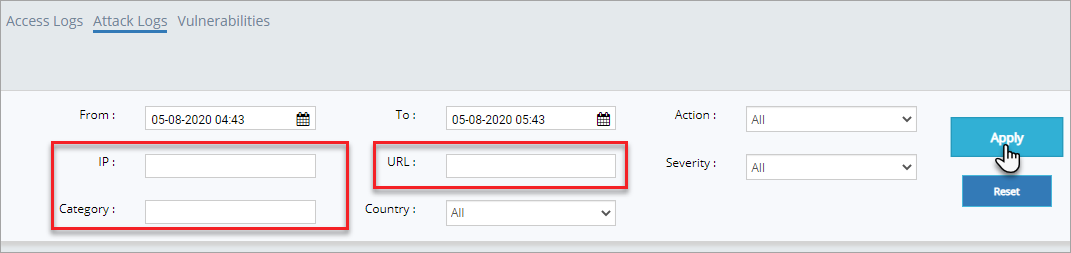
Click IP field, enter the IP address and then click Apply button to display the log details on that specific IP. Similarly, enter a specific URL and/or any particular attack Category and then click Allow button to display the list of attack logs of the specified information.
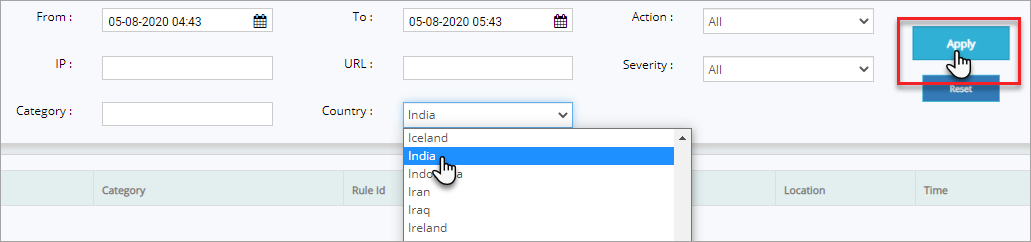
Click Country drop down, click first letter of the country for quick search an then click Apply button to display the access logs of that specific country.
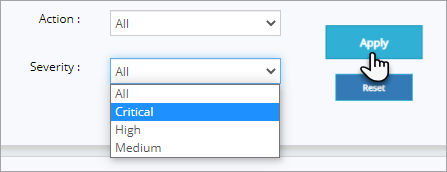
To view the attacks as per the severity level like Critical or High, click Severity drop down, click to select from the options and then click Apply button.
As per the selection(s) access log data is updated in the table with the respective information.
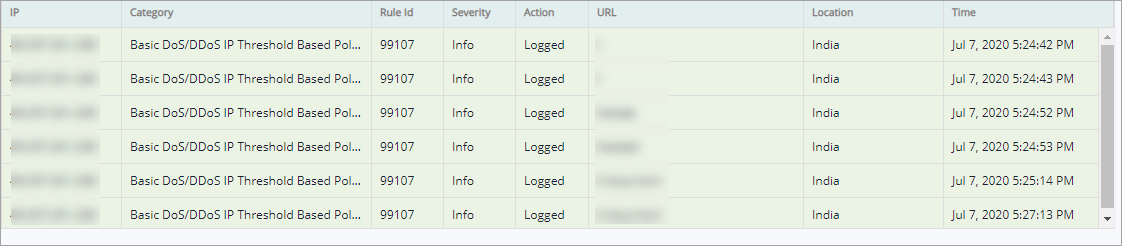
Parameter | Description |
IP | A malicious IP address attacking a website using a specific rule is displayed in this column. |
Category | This column displays the attack category of a specific IP address. |
Rule Id | The unique number of the attack rule is displayed in this column. |
Severity | This column displays, how critical an attack log which is blocked or logged i.e., Critical, High or Medium is displayed. |
Action | This column display if an attack blocked or logged. |
URL | A malicious URL used to access a website is displayed in this column. |
Location | This column displays the geographical location of an attacker. |
Time | The exact time and date of an attack is registered and displayed in this column. |
Vulnerabilities
This page displays the list of vulnerabilities discovered along with severity of protection, URL with the vulnerability, Protection status and much more. Detected by Manual Pen Test and/or Auto scan and Protected by Advance Rules and/or Premium Rules and/or Custom Rules can be viewed separately by specifying a parameter in the respective field. By default, all the data available is displayed.
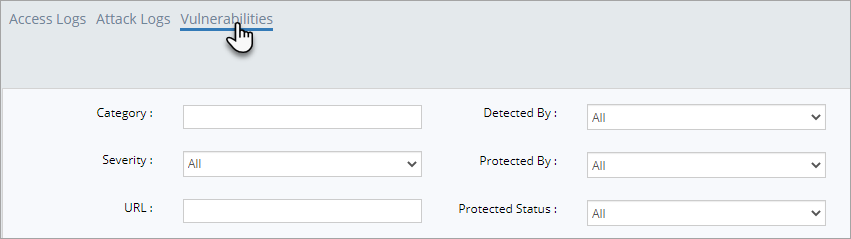
In order to dial down the vulnerability search, few parameters like Category, Detected by, Severity, URL etc., are displayed.
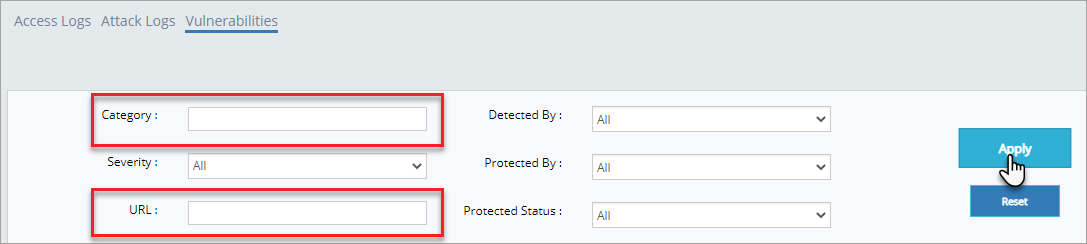
Click Category field, enter a category name or just the starting letter and then click Apply button to display the vulnerability details.
Similarly, click URL field and enter a specific url and then click Apply button to display vulnerabilities
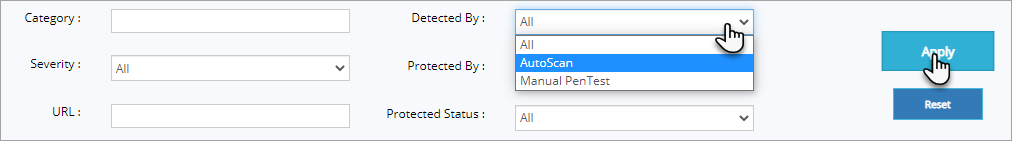
To view the vulnerability data based on scan details like Auto scan detected or Manual Pen Test detected vulnerabilities or both select a parameter from Detected By drop down as follows:
Click Detected By drop down, click AutoScan or Manual Pen Test option and then click Apply button.
The selected scan type is displayed in Detected By column with Vulnerability names, Severity, URL etc., details.
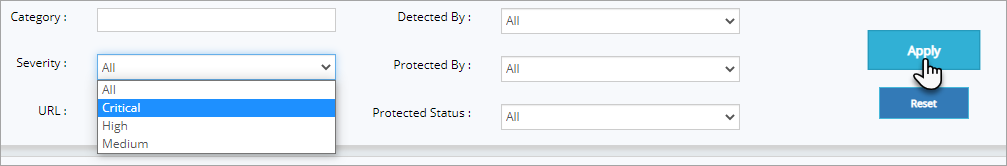
To display the vulnerability details as per the severity of protection like critical, high etc.
Click Severity drop down, click to select Critical option, and then click Apply button to display only critical vulnerability details. Similarly select High and/or Medium options to display respective vulnerability details.
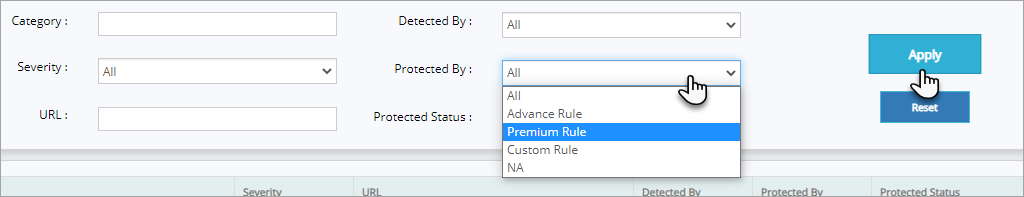
To display the vulnerabilities protected by Advance rules or Premium rules etc., separately:
Click Protected By drop down, click to select any one of the options displayed i.e., Advance Rule and then click Apply button.
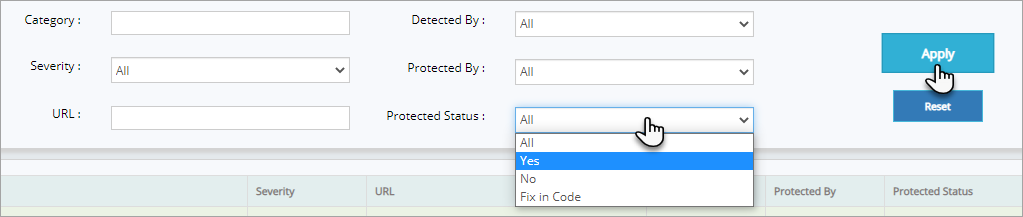
To display the vulnerability details of a specific protection status like No, Yes, and Fix in Code
Yes: When protection status is a Yes, it means a website is protected from that specific vulnerability.
No: When a protection status is a No, it means a website is not yet protected from that specific vulnerability.
Fix in Code: When a protection status is Fix in Code, it means a website's vulnerability can only fixed by fixing that application code.
Click Protection Status drop down, click to select Yes and then click Apply button.
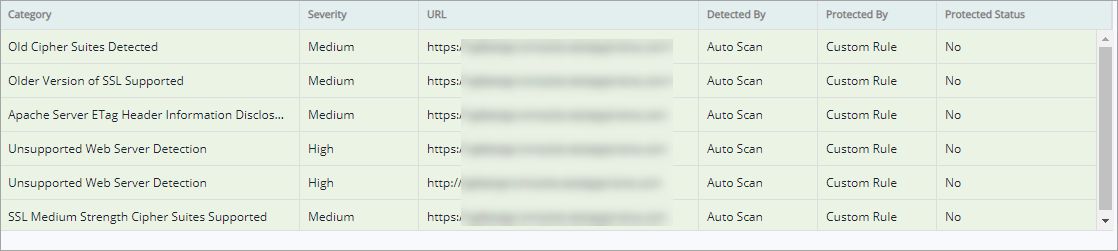
As per the selection(s) Vulnerability data is updated in the table as follows:
Parameter | Description |
Category | This column displays the vulnerability category name for a specific scan. |
Severity | This column displays the severity of a specific vulnerability like critical, High etc., which helps a user to understand how serious is a website's vulnerability. |
URL | This column displays the URL of the website being scanned. |
Detected By | There are 2 types of scans i.e., Auto Scan and Manual Pen Test to detect a vulnerability. This column displays if a specific vulnerability is detected by any one of the mentioned scan. |
Protected By | There are various rules created for different level of protection like Premium Rules, Advance Rules etc. This column displays, which rule is applied on the vulnerability. |
Protection Status | This column displays if a vulnerability is protected or yet to be protected or if there is a Fix in code which causing an application vulnerable. |
Event Logs
All AppTrana users can now review all actions taken by users on the AppTrana portal, be it modifying CDN enablement, requesting for CR, updating the SSL certificate, or any other actions. This helps in understanding any changes in WAF configuration/ behavior
This section gives the details of all the actions done by the users:

Event Logs Categories
All actions on the portal are categorized into ‘Event Log Categories’ and the respective events are listed below.
Each event will be recorded and as per the selection, data will be displayed in the table along with the description of each activity.
Event Log Category | Activities |
Account Level Activities |
|
Login Activities |
|
User Level Activities |
|
Group Management Activities |
|
Website Level Activities |
|
Set the Time Period
- Click on the Event Logs tab.
- Click the Calendar icon in the From field and then select the date.
- To select the logs from a specific time along with the date, click the Clock Icon given in the Calendar.
- Enter a digit or adjust the time, select AM or PM, and then click on the Set Time button.

- Click on the Calendar icon in the To field and select the date till the logs data is required.
- To select a specific time along with the date, click the Clock Icon given in the Calendar.
- Enter a digit or adjust the time, select AM or PM, and then click Set Time.

- Customers can filter the event logs data by Users, Websites, and Categories.
How does the Event Logs Feature work?
- Click on the from and to date fields to set the date and time.
- Select a specific user or all users in the Users field.
- Go to the Categories field, select any category from the drop-down and then click Apply button.
- For Website level categories, click on the Website Level Activities option.
- Click on the Websites drop-down to select the website and then click on the Apply button.

- The event logs of the selected website and/or category will be displayed on the table.
Download CSV
This feature enables AppTrana customers to export Access logs, Attack logs, and Vulnerabilities data to CSV format.
How does it work?
For Access logs:
- Select Analysis tab on the left pane.
- Access logs button is selected by default and there you can find the Download CSV button.
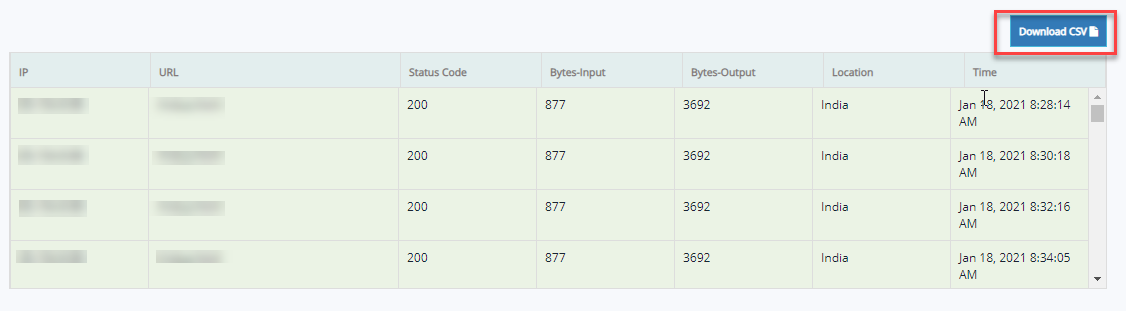
- Click Download CSV button to get the access logs details in CSV format.
- The CSV file gives access logs details of a particular website and that looks like this:
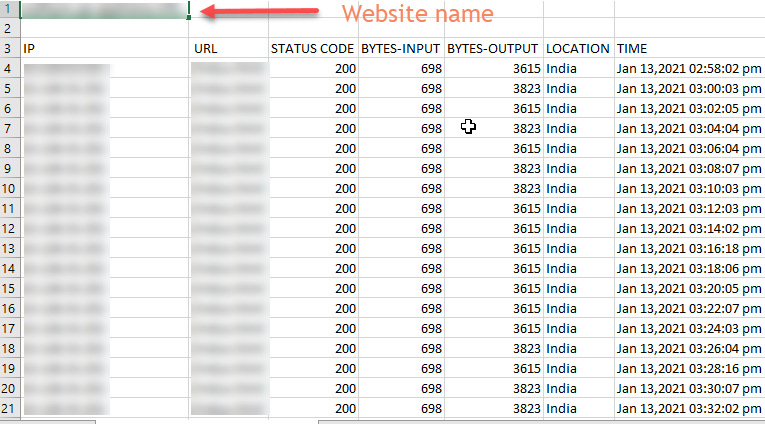
- To download the specific access details of a website for a particular period, set the date in from and to field, and click apply.
- The table will display the filtered data and click Download CSV.
- The downloaded CSV file will display only the selected period details. Likewise, customers can filter and download the data for specific URL, IP, status code, and location.
For Attack Logs:
- Click Attack logs button on Analysis page and there you can find the Download CSV button.
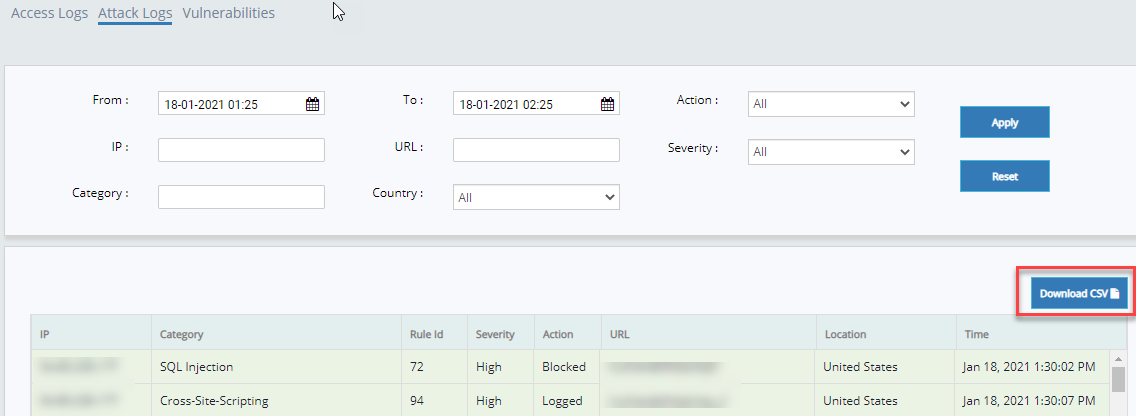
- Click Download CSV button to get the attack logs data in CSV format.
- The CSV file gives the attack logs data of a particular website and that looks like this:
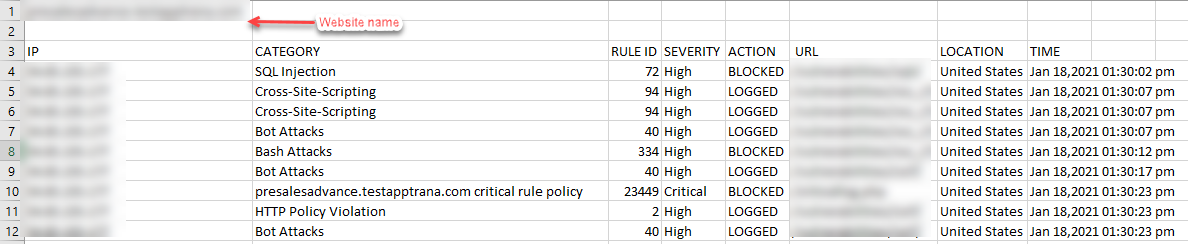
- To download the specific attack details of a website for a particular period, set the date in from and to field, and click apply.
- The table will display the filtered data and click Download CSV.
- The downloaded CSV file will display only the selected period details. Likewise, customers can filter and download the data for specific IP, URL, severity, category, and location.
For Vulnerabilities:
- Click Vulnerabilities button on Analysis page and there you can find the Download CSV button.
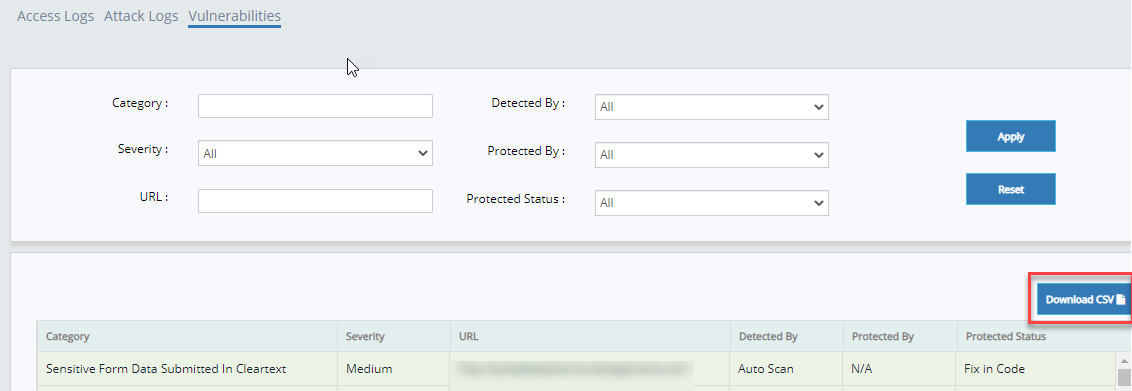
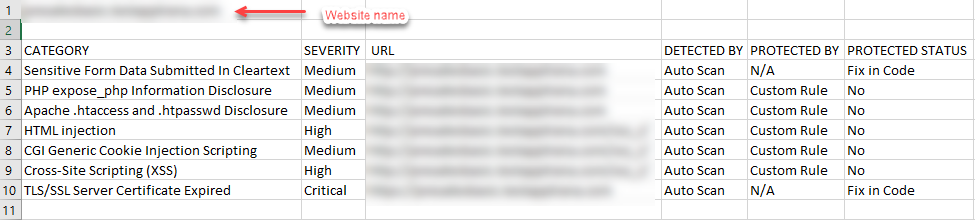
- Click Download CSV button to get the Vulnerabilities data in CSV format.
- The CSV file gives the vulnerabilities data of a particular website and that looks like this:
- To download the specific vulnerability details based on severity, detected by, category, protected by, and URL, select a particular detail to apply filter.
- After filtering the data, click Download CSV button.
For Event Logs
Click on the Event Logs button on the analysis page, select the data by, and there you can find the Download CSV option.

Users can drag and view the event logs data in the table. Also, users can export the logs data by clicking on the Download CSV button.
- Website_Level_Activities_EventLogs
- Login_Activities_EventLogs
- Account_Level_Activities_EventLogs
- User_Level_Activities_EventLogs
- Group_Management_Activities_EventLogs