AppTrana
Getting Started
Frequently Asked Questions
Product Details
API Scan Coverage for OWASP Top 10
Whitelist Vulnerabilities on the AppTrana WAAP
API Request to Purge CDN Data
Analysis page - Attack Trend Visualisation
Advanced Behavioral DDoS
BOT Protection
Asset Discovery
Customize Application Behavior with Bot Score
Restricted Admin User
Self Service Rules
Configuring Custom Error Page in AppTrana
Enabling SIEM Integration
API Discovery Feature
SwyftComply
Analysis page - Access Trend Visualization
Manage WAAP Email Alerts
Enable and Configure Single Sign-On
WAF Automated Bypass and Unbypass
False Positive Analysis Report on WAAP
Product User Guide
Indusface WAS
Getting Started
Product User Guide
Summary
Dashboard
Malware Monitoring[MM]
Application Audit[AA]
Vulnerability Assessment[VA]
Reports
Settings
Asset Monitoring
New Reporting Structure
Frequently Asked Questions
Feature Summary
AcuRisQ – Risk Management with Advanced Risk Scoring
WAS Consulting License
API Key Based - Scan Log Export
WAS Defacement Checks
SIEM Integration with Sumo Logic
Indusface WAS Scanned Vulnerabilities
Total Application Security
Onboarding Documents
Indusface Newsletter
Indusface Product Newsletter - October 2021
Indusface Product Newsletter- April 2021
Indusface Product Newsletter-January21
Indusface Product Newsletter - June 20
Indusface Product Newsletter - October 19
Indusface Product Newsletter - August 19
Product Newsletter of May 19
Product Newsletter of March 19
Product Newsletter of January 19
WAF Portal Revamp June 18
Product Newsletter of July 18
Product Newsletter of May 18
Product Newsletter of March 18
Product Newsletter of February 18
Product Newsletter of January 18
Indusface Product Newsletter - March 2022
Indusface Product Newsletter - February 2023
Indusface Product Newsletter- October 2022
Zero Day Vulnerability Reports
Vulnerabilities Detected in 2023
Vulnerability Report of May 23
Vulnerability Report of March 23
Vulnerability Report of August 23
Vulnerability Report of July 23
Vulnerability Report of April 23
Vulnerability Report of November 23
Vulnerability Report of June 23
Vulnerability Report of December 23
Vulnerability Report of February 23
Vulnerability Report of January 23
Vulnerability Report of September 23
Vulnerability Report of October 23
Vulnerabilities Detected in 2016
CRS vs. Zero Day Vulnerability - December 2016
CRS vs. Zero Day Vulnerability - November 2016
CRS vs. Zero Day Vulnerability - October 2016
CRS vs Zero Day Vulnerability - September 2016
CRS Vs Zero Day Vulnerabilities - August 2016
Vulnerabilities Detected in 2017
Vulnerability Report of April 17
Vulnerability report for Apr 3rd - Apr 9th 17
Vulnerability report for April 17th - Apr 23rd 17
Vulnerability report of April 10th - April 16th
Vulnerability Report of March 17
Vulnerability report for Mar 20th - Mar 26th
Vulnerability report for Mar 13th - Mar 19th
Vulnerability report for 27th Feb - 5th Mar
Vulnerability report for Mar 27th - Apr 2nd
Vulnerability report for Mar 6th - Mar 12th
Vulnerability Report of February 17
Vulnerability Report of January 17
Vulnerability Report of December 17
Vulnerability Report of November 17
Vulnerability Report of August 17
Vulnerability Report of September 17
Vulnerability Report of October 17
Vulnerability Report of July 17
Vulnerability Report of June 17
Vulnerability Report of May 17
Vulnerabilities Detected in 2018
Vulnerability Report of December 18
Vulnerability Report of November 18
Vulnerability Report of October 18
Vulnerability Report of September 18
Vulnerability Report of August 18
Vulnerability Report of July 18
Vulnerability Report of June 18
Vulnerability Reports of May 18
Vulnerability Report of April 18
Vulnerability Report of March 18
Vulnerability Report of February 18
Vulnerability Report of January 18
Vulnerabilities Detected in 2019
Vulnerability Report of December 19
Vulnerability Report of November 19
Vulnerability Report of October 19
Vulnerability Report of September 19
Vulnerability Report of August 19
Vulnerability Report of July 19
Vulnerability Report of June 19
Vulnerability Report of May 19
Vulnerability Report of April 19
Vulnerability Report of March 19
Vulnerability Report of February 19
Vulnerability Report of January 19
vulnerabilities Detected in 2020
Vulnerability Report of December 20
Vulnerability Report of November 20
Vulnerability Report of October 20
Vulnerability Report of Sep 20
Vulnerability Report of July 20
Vulnerability Report of June 20
Vulnerability Report of May 20
Vulnerability Report of April 20
Vulnerability Report of March 20
Vulnerability Report of February 20
Vulnerability Report of January 20
Vulnerabilities Detected in 2021
Vulnerability Report of November 21
Vulnerability Report of October 21
Vulnerability Report of September 21
Vulnerability Report of August 21
Vulnerability Report of July 21
Vulnerability Report of June 21
Vulnerability Report of May 21
Vulnerability Report of April 21
Vulnerability Report of March 21
Vulnerability Report of February 21
Vulnerability Report of January 21
Vulnerability Report of December 21
Vulnerabilities Detected in 2022
Vulnerability Report of January 22
Vulnerability Report of February 22
Vulnerability Report of March 22
Vulnerability Report of April 22
Vulnerability Report of May 22
Vulnerability Report of June 22
Vulnerability Report of July 22
Vulnerability Report of August 22
Vulnerability Report of September 22
Vulnerability Report of October 22
Vulnerability Report of November 22
Zero-Day Vulnerability Report - December 2022
Vulnerabilities Detected in 2024
Security Bulletin
Vulnerabilities 2024
Critical Apache OFBiz Zero-day AuthBiz (CVE-2023-49070 and CVE-2023-51467)
ScreenConnect Authentication Bypass (CVE-2024-1709 & CVE-2024-1708)
CVE-2024-1071 – Critical Vulnerability in Ultimate Member WordPress Plugin
Oracle WebLogic Server Deserialization
ApacheStructs_VG
Apache Struts 2 Vulnerability CVE-2023-50164 Exposed
Unpacking the Zimbra Cross-Site Scripting Vulnerability(CVE-2023-37580)
Adobe ColdFusion Vulnerabilities Exploited in the Wild
Remote Unauthenticated API Access Vulnerabilities in Ivanti
Multiple Moveit Transfer Vulnerabilities
HTTP/2 Rapid Reset Attack Vulnerability
Apache log4j RCE vulnerability
Table of Contents
Summary

Summary page displays a brief or a gist of the security provided to existing websites, as per the scans performed and vulnerabilities found. Vulnerabilities found with a specific scan type is displayed on the top.
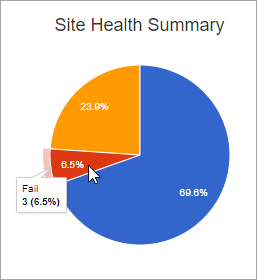
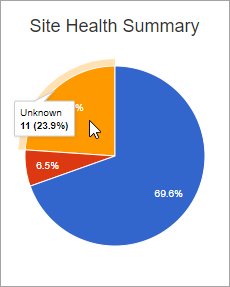
Site Health Summary pie chart displays the specifying percentages for Pass, Fail and Unknown scan status.
Group and Sites option displays the available data with all the scan details.
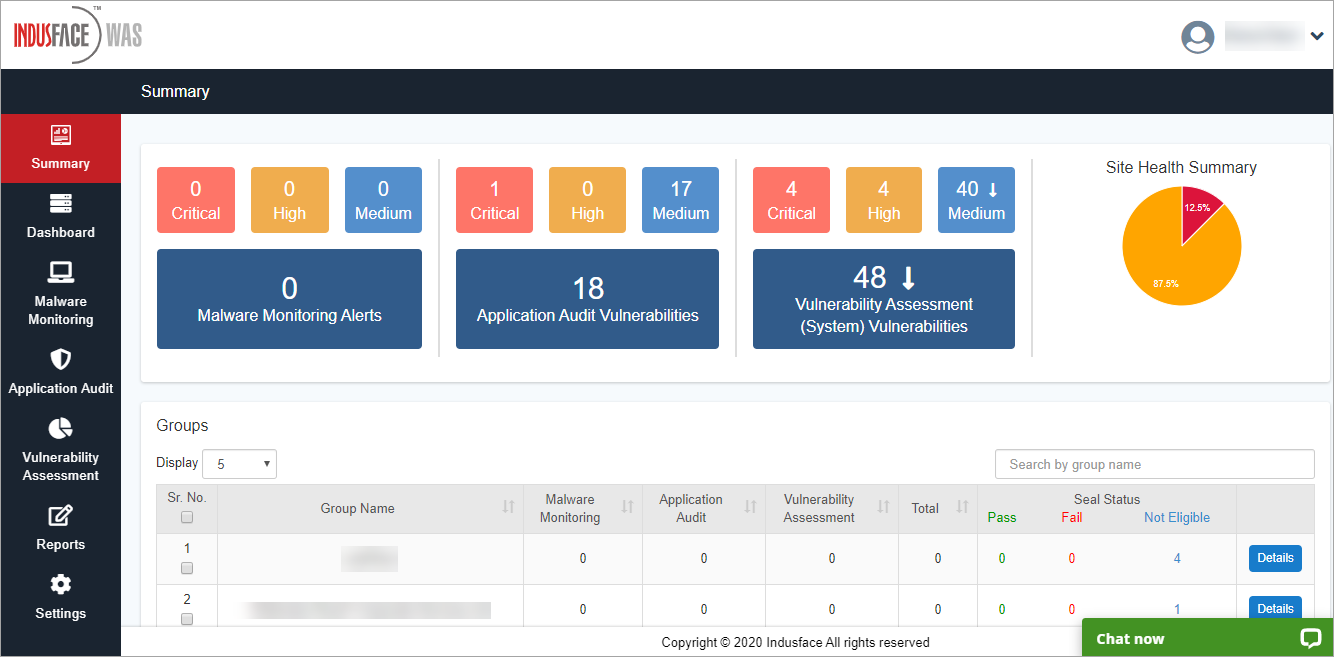
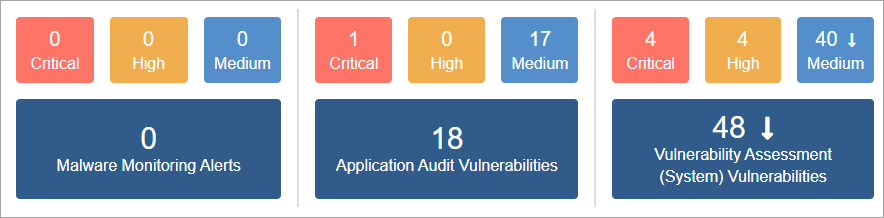
Vulnerabilities Found
The vulnerabilities found from the performed scans is displayed in this option. Along with the count, the scan type is also displayed
Upward or Downward arrows specify the vulnerability Increase or Decrease from the past scan respectively.
Site Health Summary
A website's health summary is classified into 3 parts, each specified with a colour i.e., Pass(blue), Fail(red), and Unknown(Yellow) with percentages.
Cursor over a specific colour of the graph to find out the details like Health Status(pass, fail etc.,) and Vulnerability Count.
Pass
A scan is shown as pass if there is no Critical or High vulnerabilities found in the latest scan for all the 3 scan services that is Application Audit, Malware Monitoring, and Vulnerability Assessment.
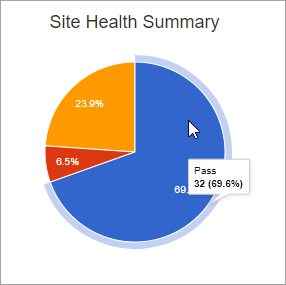
Fail
A security scan is termed as Fail for any one of the scan services if it has some Critical or High vulnerabilities which needs an immediate attention.
Unknown
Site Status is marked as Unknown if a user is not subscribed to all 3 services or if scan is not complete for all 3 services.
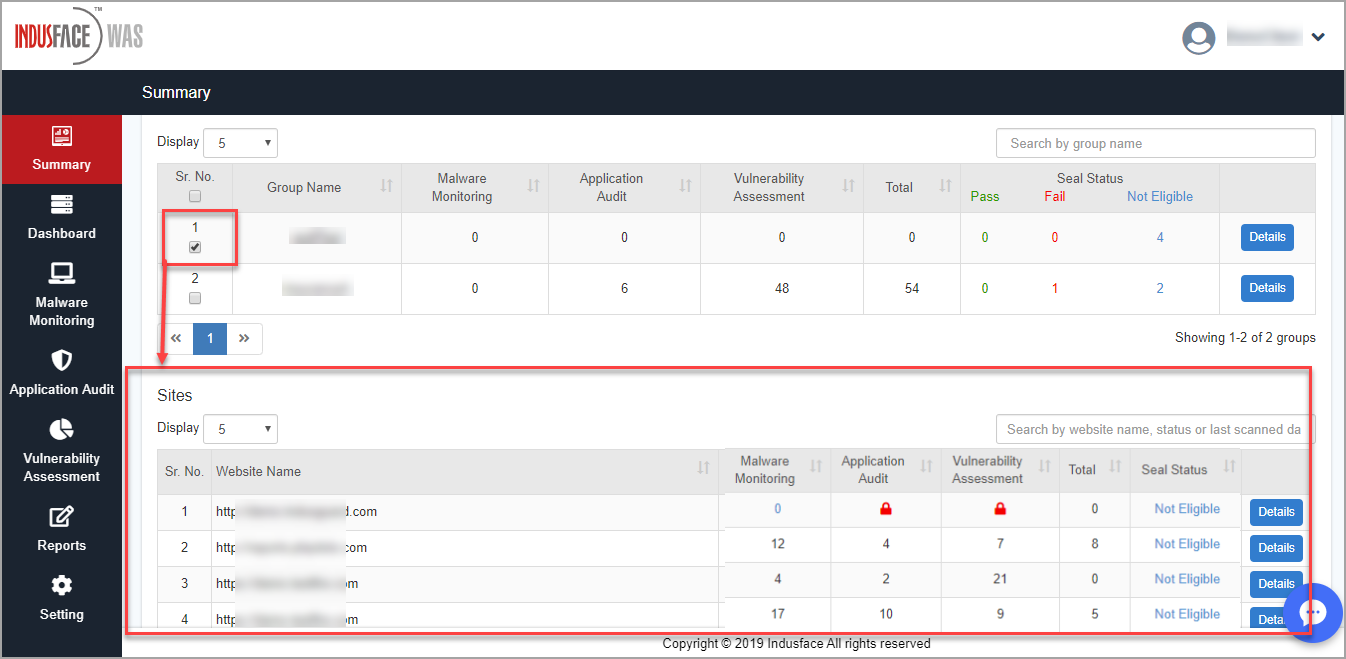
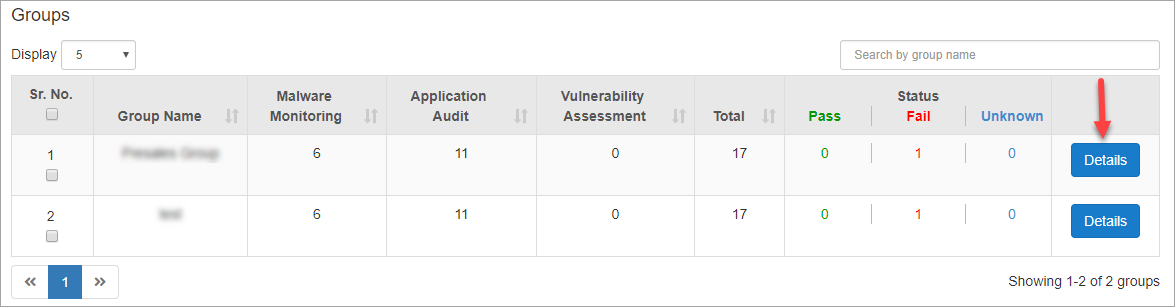
Group(s)
This option displays the existing groups and it's details like subscribed Scan Services, Total Vulnerability Count, Scan Status etc.
Click Groups option to select multiple groups, all the websites associated with the groups is displayed in Sites option.
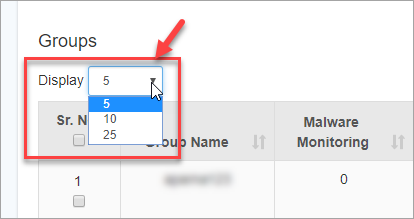
Click Display drop-down and click any one of the displayed number. The allows the selected number of records to be displayed.
Click Details button to view complete of website security status. Dashboard page with the Group details appear.
The selected group is displayed in Web Application drop-downs.
The detailed information of a selected group like threats found by recent scans, top threats found etc., are displayed in the graphical format.
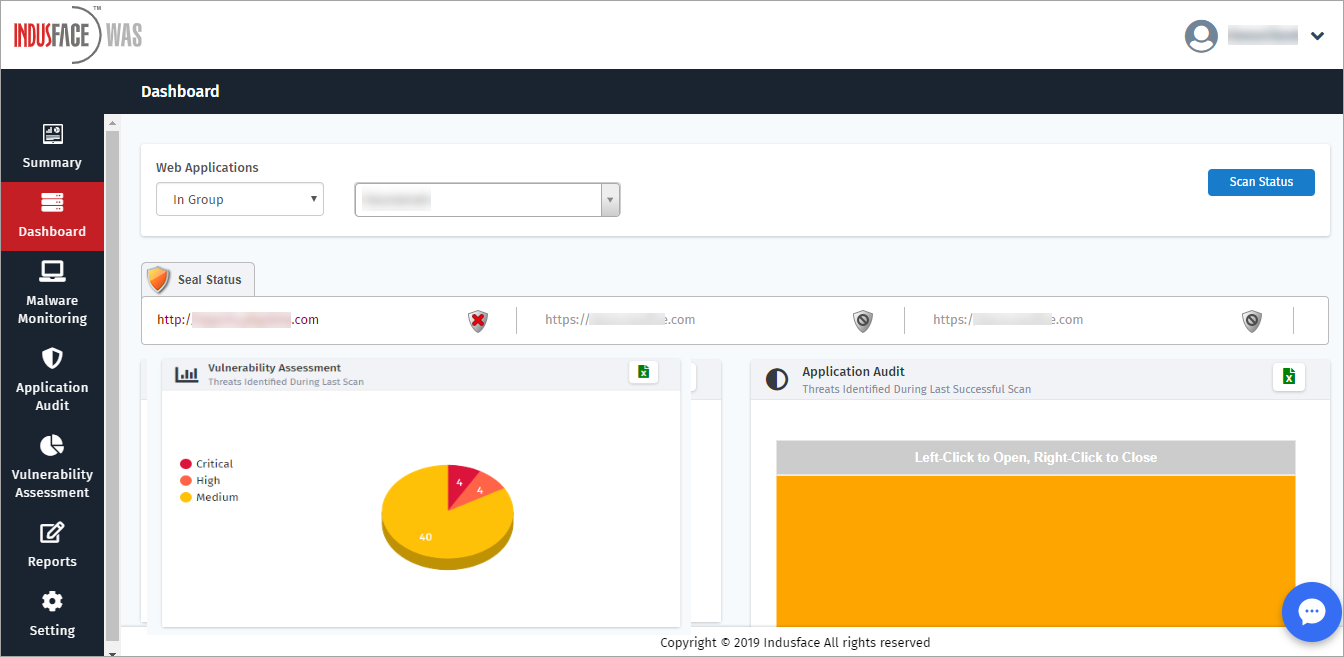
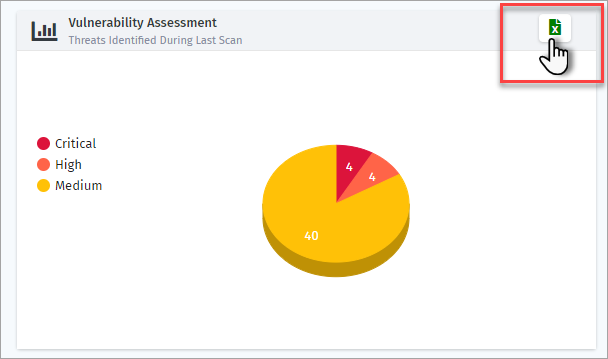
Click Excel Sheet icon to download the report in CSV format.
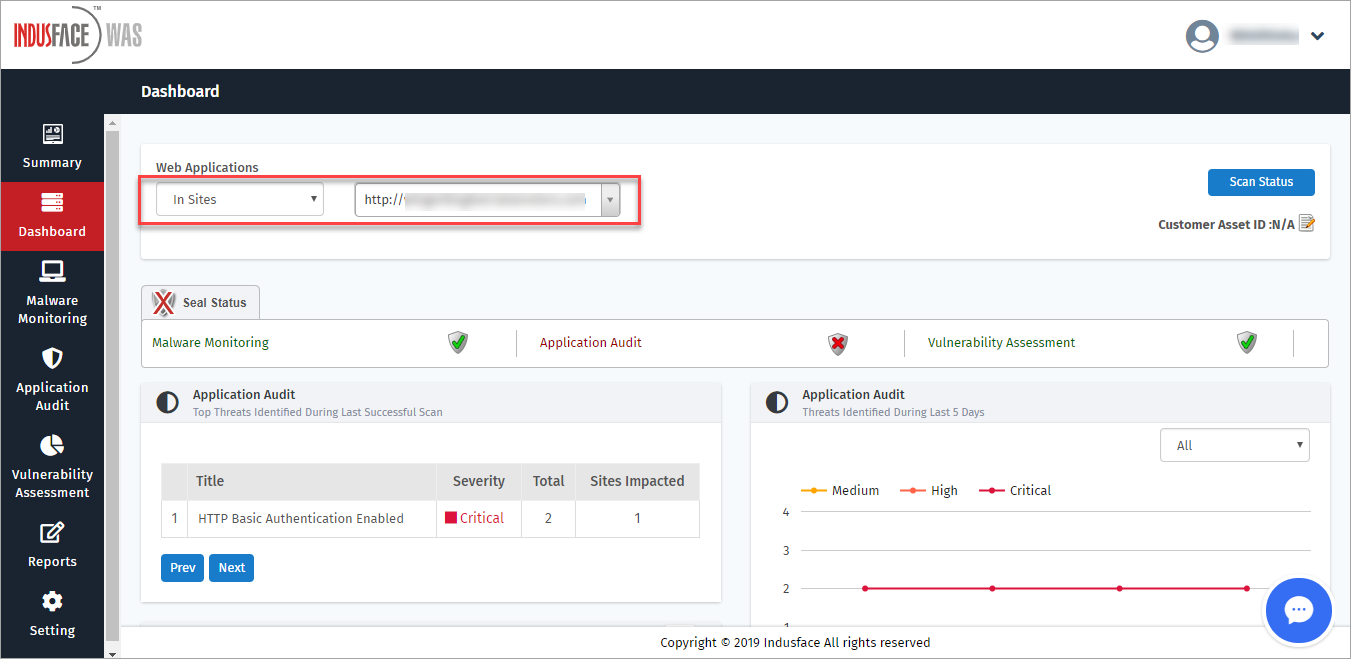
Site(s)
This option displays the summary of the existing websites of a specific user. Some of the details are no. of vulnerabilities found in all the 3 scans, Scan Status, Last Scan.
Hyphen is displayed if scan type is unsubscribed in Sites column. Zero indicates no vulnerabilities found.
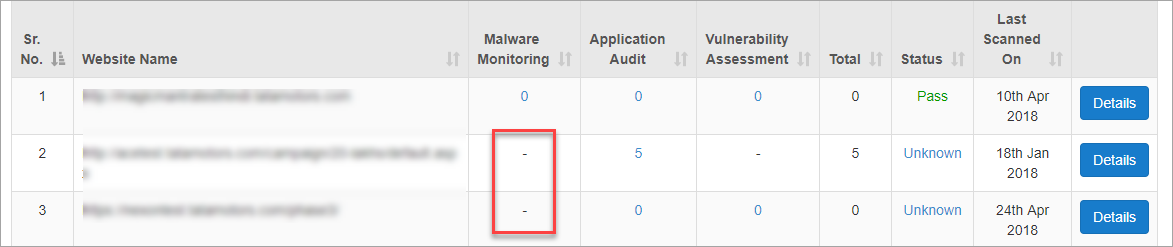
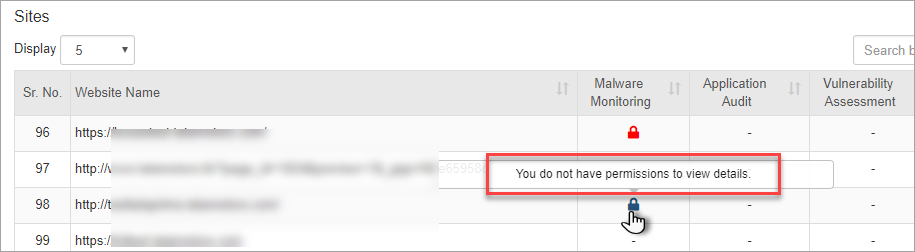
Lock icon is displayed for the scans with no permission to view the details. Cursor over the icon to view the same message.
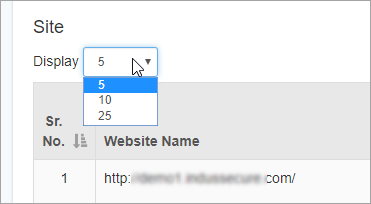
Click Display drop-down and click any one of the displayed number. This allows the selected number of records to be displayed.
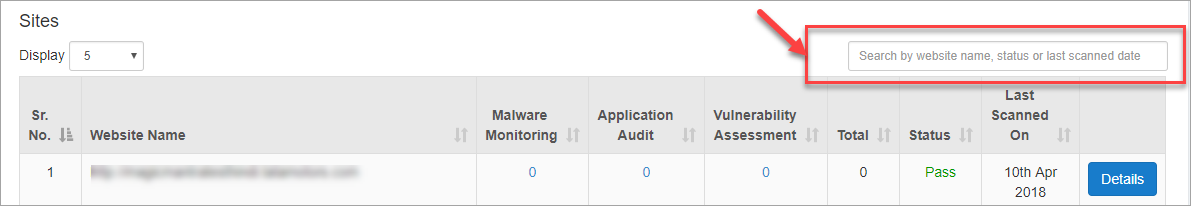
Click Search box on the right and enter Website Name, Status or Latest Scanned Date to view the information.
Click Details button to view the further information. Dashboard page of the selected site appears.
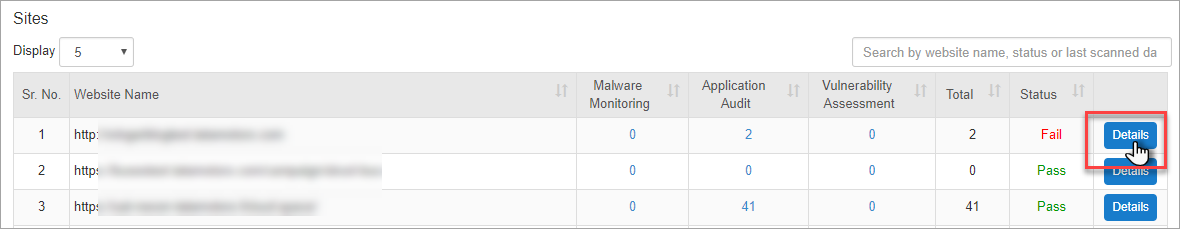
The Web Applications drop-down displays the selected website.
The latest scans performed, threats found for the subscribed scans and different statistics are displayed.